
Description
The indicator is based on analyzing price action 📈 to identify changes in market structure and key areas of interest. Below is a detailed summary of how it works:
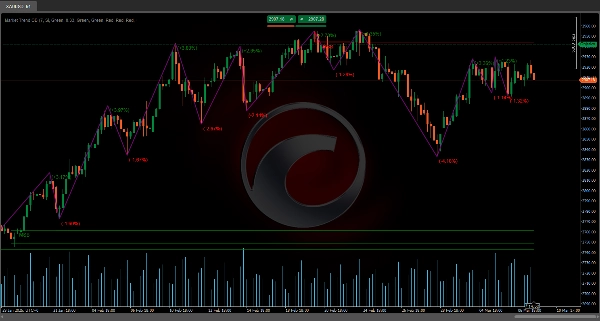
Detection of Pivots and Formation of the Zigzag 🔄
A specific period (defined by a length parameter) is analyzed to identify relative highs and lows. By comparing prices within that interval, pivot points (inflection points) are detected, which, in turn, form the zigzag pattern ⚡. This pattern helps distinguish when a price reversal occurs.
Volume Accumulation and Deviation Calculation 📊
During the pivot detection process, the tick volume is accumulated in the evaluated segment. Additionally, the percentage difference between pivot prices is calculated to determine if the movement is significant enough. This deviation is compared to a defined threshold, which helps confirm that the change in structure is real ✅.
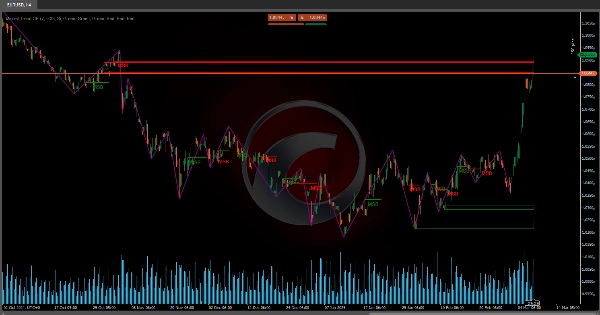
Definition of the Market Structure Break (MSB) 🚨
The indicator evaluates the last two pivots (whether highs or lows) and, by applying a retracement factor (inspired by Fibonacci levels), determines if a break in structure has occurred.
- If, after breaking an old high, the price starts generating lower lows, a shift to a bearish structure is identified 🐻.
- Similarly, if after breaking an old low, the price generates higher highs, a transition to a bullish structure is assumed 🐂.
This change is interpreted as a Market Structure Break (MSB).
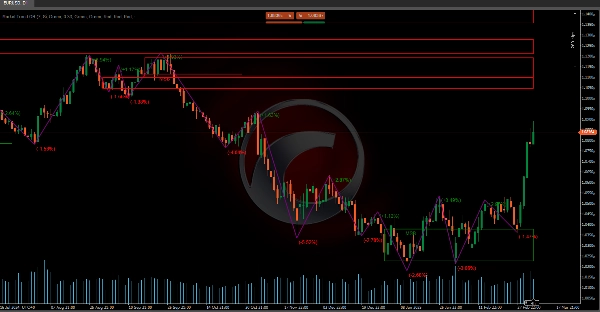
Identification of Order Blocks and Breakout Boxes 📦
Once an MSB is detected, critical zones are defined based on previous price action:
- Order Blocks (OB) 🧱: These are identified as zones where the last significant action occurred before the breakout. In a bearish structure, the last bullish candle before the new high is taken; in a bullish structure, the last bearish candle before the new low is used.
- Breakout Boxes (BB) 📈: These are determined similarly but consider an additional range to confirm that the price broke the previous level.
These zones help define areas where activity is concentrated and may act as support or resistance in the future.
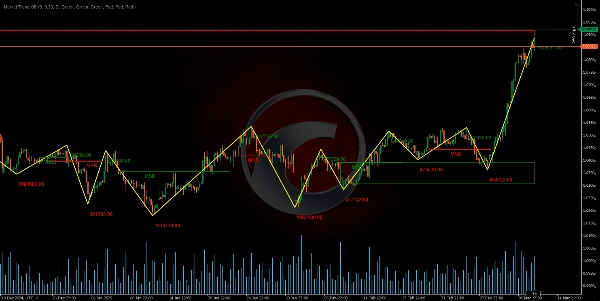
Visualization of Relevant Zigzag Data 📊
In addition to plotting the sequence of pivots, the indicator incorporates additional data:
- Reversal Price 💹: The exact value where the trend change is detected is recorded.
- Reversal Percentage Change 🔄: The percentage variation between the new pivot price and the previous one is calculated, indicating the magnitude of the change.
- Accumulated Volume 📉: The sum of tick volume during the segment leading to the pivot formation is displayed.
This data allows for assessing the strength and relevance of the movement without relying on assumptions, as it is based on concrete calculations.
In summary, the tool analyzes price action to detect when the market changes trend (MSB) and defines zones (order blocks and breakout boxes) that can be key for trading decisions 💼. The integration of the zigzag pattern with volume analysis and percentage deviations provides a comprehensive view of market structure, offering precise information about reversal points and the strength of the movement 💪.
Ctrader Store indicators:
Dynamic Market Structure
Analysis of Turning Points
Fibonacci Linear
Regression Multi-timeframe
Multi-Level Candle Bias
Tracker
Auto Support and
Resistance Trend Lines
Summary
It defines Market Structure Breaks (MSB) by evaluating recent pivots with a retracement factor inspired by Fibonacci levels. A break in structure is signaled when price action shifts from higher highs to lower lows (bearish) or from lower lows to higher highs (bullish).
Upon detecting an MSB, the indicator identifies critical zones: Order Blocks (OB), representing the last significant candle before a breakout, and Breakout Boxes (BB), which confirm price level breaches with an additional range. These zones serve as potential future support or resistance areas.
The tool visualizes relevant zigzag data, including reversal prices, percentage changes, and accumulated volume, enabling assessment of movement strength and relevance based on concrete calculations. This comprehensive approach integrates zigzag patterns, volume analysis, and deviation metrics to provide precise information on reversal points and market movement strength, supporting informed trading decisions.
Customer reviews
5 | 100 % | |
4 | 0 % | |
3 | 0 % | |
2 | 0 % | |
1 | 0 % |


