

Açıklama
Pinescriptlabs Mağaza göstergeleri: Pinescriptlabs Mağaza cBotları : (cBot) Gold & BTC BreakoutOturum Pivotları(yeni)
Gelişmiş Piyasa Yapısı: Bos, Choch, SwinLevels, Emir Blokları, Piyasa Yapısı & Likidite Bulucu (Yeni)
ZigZag Fiyat Likidite Projeksiyonu
Akıllı Takip Algoritması (yeni)
AkıllıTrend Destek &
Direnç
Çizgiler
Dinamik
Piyasa Yapısı
Analizi
Dönüş
Noktaları
Analizi
Fibonacci
Doğrusal
Regresyon
Çok Zamanlı
Çok Seviyeli
Mum Eğilimi
Takipçisi
Otomatik
Destek ve
Direnç
Trend
Çizgiler
Tüm
Destek ve
Direnç
Seviyeleri
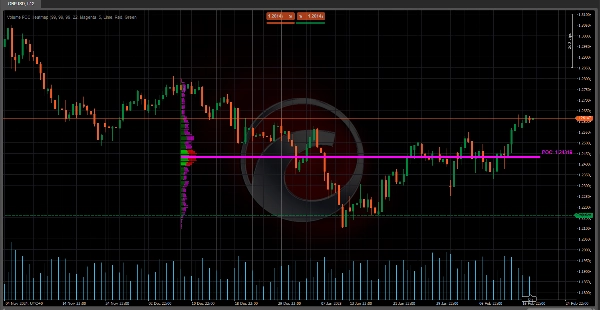
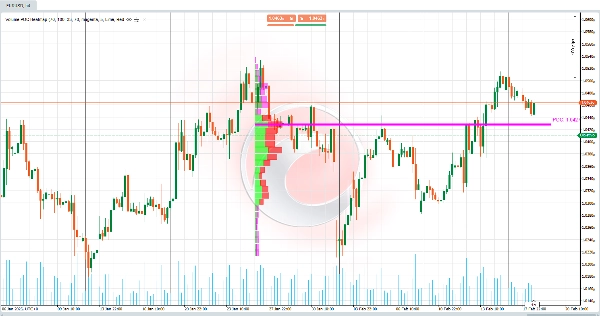
🔥 Hacim POC Isı Haritası 🔥
Bu gösterge, belirli bir dönemde farklı fiyat seviyeleri boyunca işlem gören hacim dağılımını gösteren bir Hacim Profilidir. Ana amacı, önemli destek/direnç bölgelerini ve piyasanın en çok ilgi gösterdiği alanları (yüksek alım/satım aktivitesi) belirlemektir. Aşağıdakiler için çok faydalıdır:
- Kontrol Noktasını (POC) Tespit Etme 🎯
En yüksek hacme sahip fiyat seviyesi, fiyat hareketi için mıknatıs görevi görür. - Değer Alanını (VA) Görselleştirme
Toplam hacmin belirli bir yüzdesinin (örneğin %70) yoğunlaştığı bölge, alıcılar ve satıcılar arasındaki dengeyi gösterir. - Boğa ve Ayı Hacmini Ayırt Etme 📈📉
Alım gücü ile satış baskısının nerede biriktiğini gösterir.
🧠 Ana Mantık & Hesaplamalar 🔢
- Fiyat Aralığı Bölümü 📏
-
- Fiyat aralığı (son B Barları içindeki en düşükten en yükseğe kadar) Hacim Hücreleri (CNum) olarak bölünür.
Örnek: Eğer CNum = 33 ise, aralık 33 eşit uzaklıktaki seviyeye bölünür.
- Fiyat aralığı (son B Barları içindeki en düşükten en yükseğe kadar) Hacim Hücreleri (CNum) olarak bölünür.
- Seviyeye Göre Hacim Dağılımı 📊
-
- Geçmiş verideki her bar için:
-
- Gövde (açılış ve kapanış farkı) ve fitiller (yüksek ve düşükler) ile ilişkili hacim hesaplanır.
- Hacim, barın kesiştiği fiyat hücrelerine orantılı olarak dağıtılır.
Örnek: Eğer yeşil (boğa) bir bar 3 hücreyi kapsıyorsa, hacim esas olarak bu hücrelere "boğa hacmi" olarak atanır.
- Kontrol Noktası (POC) Hesaplaması 🎯
-
- POC, en yüksek birikmiş hacme sahip hücredir ve alıcılar ile satıcılar arasında en çok uzlaşılan fiyatı temsil eder.
- Değer Alanı (VA) Hesaplaması 🔄
-
- POC'den yukarı/aşağı doğru belirtilen toplam hacim yüzdesini (örneğin %70) kapsayana kadar genişler.
Örnek: Eğer VA aralığı 100 ile 105 arasında ise, bu aralıkta %70 hacim işlem görmüştür.
- POC'den yukarı/aşağı doğru belirtilen toplam hacim yüzdesini (örneğin %70) kapsayana kadar genişler.
- Görsel Normalizasyon 🖼️
-
- Hacimler, grafikteki çubukların genişliğini ayarlamak için bir Ölçek Faktörü kullanılarak ölçeklendirilir, böylece görselleştirme kolaylaşır.
🛠️ Hacim POC Isı Haritasının Anahtarı 💡
- Geleneksel Hacim Göstergelerinde Bağlam Eksikliği 🤔
Klasik hacim göstergeleri (bar bazında hacim gibi) hacmin nerede işlem gördüğünü göstermez. Bu gösterge, hacmi fiyat seviyesine göre haritalandırarak bu sorunu çözer. - Organik Destek/Direnç Tanımlaması 🚀
Yüksek hacimli bölgeler, statik çizgilere göre daha güvenilir dinamik destek/direnç olarak işlev görür. - Dengesizliklerin Tespiti ⚖️
Ağırlıklı olarak boğa veya ayı hacminin olduğu alanlar, potansiyel kırılma veya dönüş sinyalleri verir.
💡 Ticarette Pratik Kullanım 📈
- POC İlgi Bölgesi Olarak 🎯
-
- Fiyat POC'ye yaklaştığında, tepki olarak sıçramalar veya konsolidasyonlar beklenir.
- Değer Alanı (VA) Denge Bölgesi Olarak 🔄
-
- Fiyat VA dışındaysa, genellikle VA'ya geri dönme eğilimindedir (manyetik etki).
- Fiyat VA içindeyse, bu konsolidasyon gösterebilir.
- Onay Olarak Boğa/Ayı Hacmi 🔍
-
- Dirençte boğa hacminde ani artış, potansiyel bir kırılmayı gösterir.
- Destekte yüksek ayı hacmi, olası bir düşüşü işaret eder.
🌟 Örnek 📊
Kullanılan Parametreler (Kullanıcı tarafından Görünür ve Yapılandırılabilir):
- Geriye Dönük Barlar = 55 → Analiz edilen geçmiş bar sayısı.
- Hacim Hücreleri = 33 → Fiyat aralığındaki bölme/hücre sayısı.
- Değer Alanı Hacim % = 70 → Değer Alanını tanımlayan hacim yüzdesi.
Durum:
- Fiyat teknik bir destek seviyesini kırar, ancak o bölgedeki hacim profil verilerine göre düşüktür.
- Daha sonra fiyat, toplam hacmin %70'i ile tanımlanan Değer Alanı (VA)na geri döner.
Yorum:
- Kırılma yanlıştı (kırılma bölgesindeki düşük hacim nedeniyle).
- Piyasa, daha yüksek aktivitenin olduğu (yüksek hacim yoğunluğu) Değer Alanı içinde yeniden denge arıyor.
Eylem:
- VA'nın alt sınırına veya POC'ye yakın alım fırsatları arayın, çünkü bunlar piyasa katılımcıları için yüksek ilgi bölgeleridir.
Özet
Key functionalities include:
- Division of the price range into multiple volume cells for detailed volume mapping.
- Calculation of POC as the volume consensus price.
- Determination of the Value Area around the POC.
- Visual normalization of volume bars for clearer chart representation.
This tool addresses the limitation of traditional volume indicators by showing where volume was traded rather than just total volume per bar. It helps identify dynamic support and resistance zones based on volume concentration and detects volume imbalances that may signal potential breakouts or reversals. Traders can use it to anticipate price reactions near the POC and VA, aiding in decision-making for entries and exits. Configurable parameters include the number of historical bars analyzed, volume cells, and the percentage defining the Value Area.
Müşteri değerlendirmeleri
5 | 100 % | |
4 | 0 % | |
3 | 0 % | |
2 | 0 % | |
1 | 0 % |


