
Açıklama
Pinescriptlabs Store göstergeleri: Pinescriptlabs Store cBots : (cBot) Gold & BTC BreakoutSession Pivots(yeni)
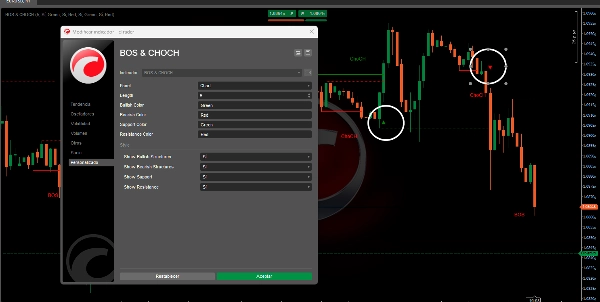
Gelişmiş Piyasa Yapısı: Bos, Choch, SwinLevels, Emir Blokları, Piyasa Yapısı & Likidite Bulucu (Yeni)
ZigZag Fiyat Likidite Projeksiyonu
Takip Eden Akıllı Algoritma (yeni)
AkıllıTrend Destek &
Direnç
Çizgileri
Dinamik
Piyasa Yapısı
Analizi
Dönüş
Noktaları
Fibonacci
Doğrusal
Regresyon
Çoklu Zaman Dilimi
Çok Katmanlı
Mum Önyargısı
Takipçisi
Otomatik
Destek ve
Direnç
Trend
Çizgileri
Tüm
Destek ve
Direnç
Seviyeleri
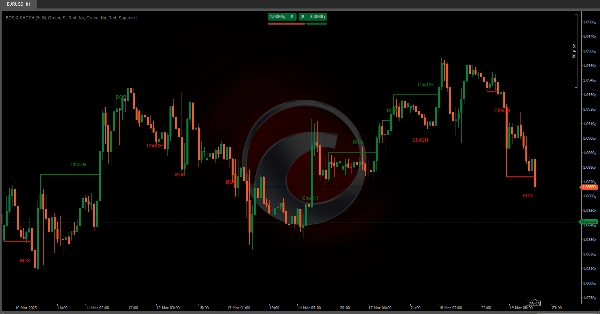
Algoritma, piyasa yapısal desenlerini tanımlamak için tasarlanmıştır, özellikle Karakter Değişimi (ChoCH) 🔄 ve Yapı Kırılması (BoS) 💥 kavramlarını. Aşağıda, bu algoritmanın ne yaptığı, amacı ve bu iki kavramı nasıl tanımladığı detaylı olarak açıklanacaktır.
Algoritma Ne Yapar?
Algoritma, fiyatın davranışını değiştirip değiştirmediğini veya önceden belirlenmiş bir yapıyı kırıp kırmadığını belirlemek için fraktalları (yerel yüksekler ve düşükler) kullanır. Ana işlevler aşağıdadır:
Fraktal Tespiti 📊
- Bir boğa fraktalı her iki tarafındaki mumlar daha düşük olduğunda yerel bir yüksek oluştuğunda meydana gelir. 📈
- Bir ayı fraktalı her iki tarafındaki mumlar daha yüksek olduğunda yerel bir düşük oluştuğunda meydana gelir. 📉
- Bu fraktallar, piyasa yapısındaki değişiklikleri tanımlamak için referans noktaları olarak görev yapar.
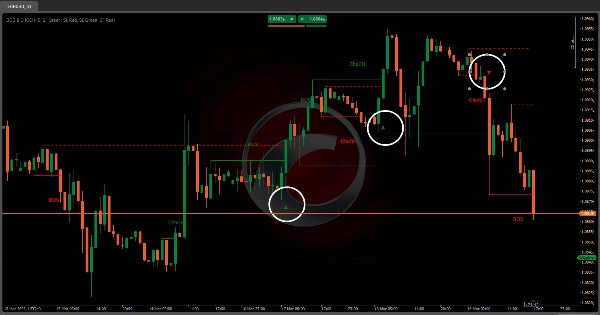
ChoCH (Karakter Değişimi) Tanımlaması 🔄
- Bir boğa ChoCH fiyat, önceden tam bir ayı yapısı oluşturmadan bir boğa fraktalını aşarsa oluşur.
- Bir ayı ChoCH fiyat, önceden tam bir boğa yapısı oluşturmadan bir ayı fraktalının altına düşerse oluşur.
- Bu, piyasanın karakterini değiştirdiğini (trendden konsolidasyona veya tam tersine) gösterir.
BoS (Yapı Kırılması) Tanımlaması 💥
- Bir boğa BoS fiyat, önceden tam bir ayı yapısı oluşturduktan sonra bir boğa fraktalını aşarsa oluşur.
- Bir ayı BoS fiyat, önceden tam bir boğa yapısı oluşturduktan sonra bir ayı fraktalının altına düşerse oluşur.
- Bu, piyasanın önceden belirlenmiş bir yapıyı kırdığını ve bunun önemli bir giriş veya çıkış noktası olabileceğini gösterir.
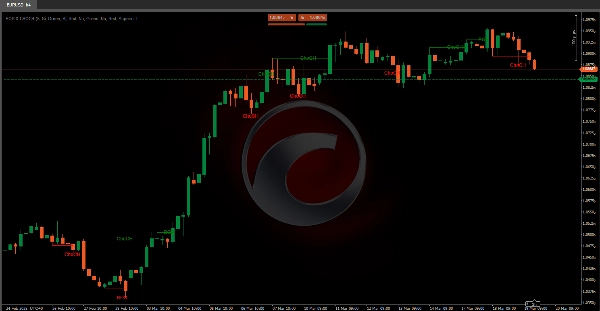
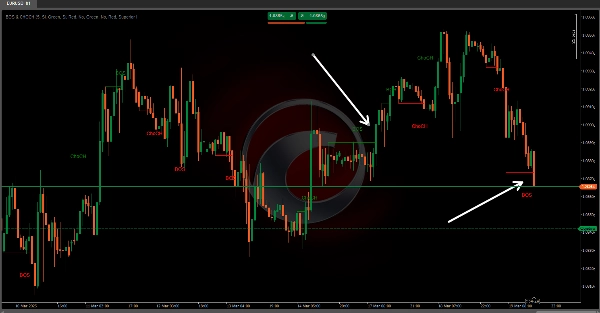
Destek ve Direncin Görselleştirilmesi 🛡️
- Algoritma, tespit edilen fraktallara dayanarak destek ve direnç çizgileri çizebilir.
- Ayrıca, bu çizgilerin kırılıp kırılmadığını kontrol eder ve kırılma noktalarını görsel simgelerle işaretler.
Bu algoritma, piyasa davranışı hakkında değerli bilgiler sunarak, önemli yapısal değişiklikleri ve potansiyel kırılma fırsatlarını net bir şekilde tanımlar. ChoCH 🔄 ve BoS 💥 sinyallerini kullanarak, yatırımcılar girişler, çıkışlar ve genel piyasa dinamikleri hakkında daha bilinçli kararlar alabilirler.
Özet
Key functionalities include:
- **Fractal Detection:** Identifies bullish fractals (local highs with lower candles on both sides) and bearish fractals (local lows with higher candles on both sides).
- **Change of Character (ChoCH):** Signals when the market changes its behavior, such as shifting from trend to consolidation, by surpassing fractals without forming a complete opposite structure.
- **Break of Structure (BoS):** Indicates when the market breaks a previously established structure, marking potential entry or exit points.
- **Support and Resistance Visualization:** Draws support and resistance lines based on fractals and marks breakout points with visual icons.
This indicator aids traders in understanding market dynamics by clearly highlighting structural changes and breakout opportunities, supporting more informed trading decisions.
Müşteri değerlendirmeleri
5 | 100 % | |
4 | 0 % | |
3 | 0 % | |
2 | 0 % | |
1 | 0 % |


