
Auto-Trend Channel
インジケーター
2.8K ダウンロード数
バージョン 1.0、Jan 2025
Windows、Mac
4.4
レビュー: 5
説明
Pinescriptlabs ストアインジケーター: Pinescriptlabs ストア cBots : (cBot) Gold & BTC ブレイクアウトセッションピボット(新着)
高度なマーケット構造:Bos、Choch、SwinLevels、オーダーブロック、 マーケット構造&流動性ファインダー (新着)
トレーリングスマートアルゴリズム (新着)
📊 オート-トレンドチャネル 📊
このインジケーターは、線形回帰の計算と価格データの標準偏差(対数)に基づいてトレンドチャネルをプロットし、自動的に選択された期間を使用します。📈 期間は ピアソン相関係数(RRR) を用いて決定され、絶対値が最も高いものを選択します。🧮
✨ 主な機能 ✨
主な機能は、最も代表的な期間長に自動適応するトレンドチャネルを計算し、高度な統計を用いて サポート、レジスタンス、および 中央トレンドライン を定義します。
チャネルには以下が含まれます:
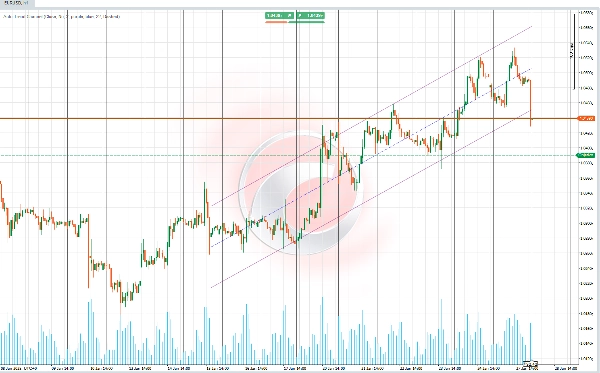
1️⃣ ベースライン:計算された線形トレンドを表します。
2️⃣ 上部および下部ライン:標準偏差に比例した距離でチャネルバンドを定義します。
🚀 特徴と計算 🚀
🔎 最適期間の計算
- インジケーターは複数のデータ期間(設定により短期または長期)を評価し、市場の動きに最も正確に相関する期間を見つけます。
- 主要な指標として ピアソン相関 を使用し、過去の価格と生成されたトレンドライン間の最も強い関係を持つ期間を特定します。
📐 線形回帰と価格予測
- 評価された各期間について、価格の自然対数に基づく回帰線が計算され、極端な変動を安定化させます。
- 計算の主要な要素は以下を含みます:
-
- 傾き:価格変動の速度を表します。
- 切片:予測線の開始点。
- 平均:基準となるベースラインを設定します。
📊 標準偏差とチャネルの限界
- 価格の回帰線に対する標準偏差が計算されます。
- 上部バンド(レジスタンス)と下部バンド(サポート)は、ユーザー設定可能な標準偏差の乗数で中央線を調整して導出されます。
🌈 トレンドチャネルの視覚化
- チャネルは3つの主要要素で構成されています:
-
- 中央線:回帰線に基づく主要なトレンドを示します。
- 上部ライン:標準偏差で調整されたチャネルの上限(レジスタンス)を表します。
- 下部ライン:標準偏差で調整されたチャネルの下限(サポート)を表します。
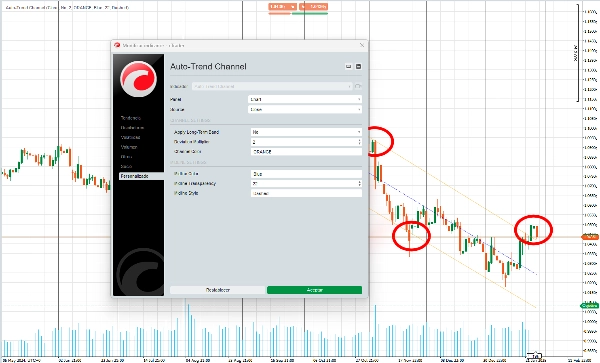
- ユーザーはチャネルの 色、透明度、およびラインスタイルをカスタマイズして視覚的な明瞭さを向上させることができます。
🎛️ 適応性と設定
- ユーザーはインジケーターのさまざまな側面を個別に設定できます:
-
- ラインとチャネルの 色。
- 長期期間(マクロトレンド)または短期期間(マイクロトレンド)に焦点を当てるかどうか。
- この適応性により、インジケーターは異なる取引スタイルや視覚的好みに対応します。
🔍 使用方法 :
1️⃣ トレンド識別
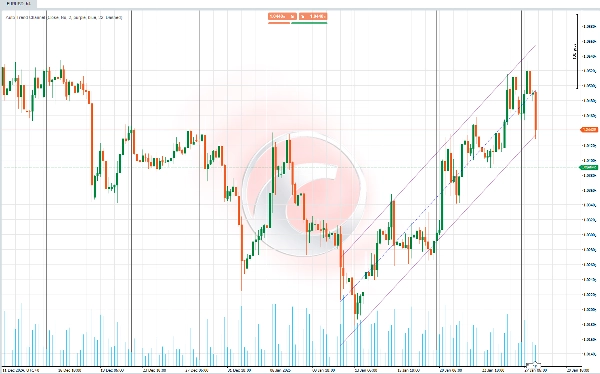
- チャネルの中央線は、市場が 上昇トレンド、下降トレンド、または 横ばいトレンドにあるかを判断するのに役立ちます。
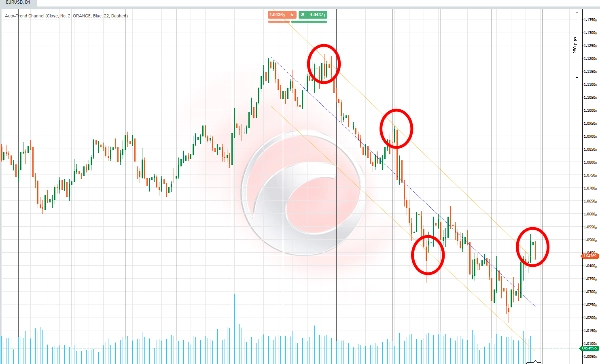
2️⃣ 動的サポートとレジスタンス
- チャネルの上下ラインは、価格が 反転または 統合する可能性のあるゾーンとして機能します。
3️⃣ 統合とブレイクアウト検出
- 価格がチャネル内に留まる場合は 統合を示し、ブレイクアウトは トレンド変化または 強い価格変動を示します。
4️⃣ 異なる取引スタイルへの調整
- 長期期間は一般的なトレンドの識別や広範な時間枠での 戦略的決定に役立ちます。
- 短期期間はトレーダーが より速い動きを捉え、即時の市場変化に対応することを可能にします。
概要
AIによる概要
Auto-Trend Channel is a trading indicator that automatically plots a dynamic trend channel using linear regression and the Pearson correlation coefficient to select the most representative period length. It calculates a baseline linear trend line based on the logarithm of price data, along with upper and lower channel lines set at distances proportional to the standard deviation, representing dynamic resistance and support levels.
Key features include:
- Optimal period selection by evaluating multiple data intervals to find the strongest correlation between historical prices and the trend line.
- Calculation of slope, intercept, and mean for precise linear regression and price projection.
- Visualization of the trend channel with customizable colors, transparency, and line styles.
- Adaptability for different trading styles by allowing focus on long-term (macro) or short-term (micro) trends.
Use cases:
- Identifying market trends (uptrend, downtrend, sideways) via the central trend line.
- Detecting dynamic support and resistance zones where price may reverse or consolidate.
- Recognizing consolidation phases within the channel and breakouts signaling trend changes or strong price movements.
- Adjusting analysis to suit strategic decisions or faster market responses depending on selected period length.
This indicator supports various markets including cryptocurrencies (BTCUSD), commodities (XAUUSD), and others, providing a statistical approach to trend and channel analysis.
インジケーターのプロフィール
カスタマーレビュー
4.4
レビュー: 5
5 | 60 % | |
4 | 20 % | |
3 | 20 % | |
2 | 0 % | |
1 | 0 % |
カスタマーレビュー
October 1, 2025
It works great and definitely helpful to track market behaviour to make more accurate decisions. Thank you!
July 9, 2025
Pros: Automatically detects and draws clear trend channels; adaptive to changing market conditions; easy setup and stable performance. Cons: No alerts on breakout or retest; lacks ability to disable channels per timeframe; can't save custom templates.
May 6, 2025
Thank its amazing. i usually trade trends. 5 star for u, be niicer if u add multitimeframe or periods like 50periods etc.
ディスカッション
よくあるご質問
BTCUSD
Breakout
Supertrend
Commodities
RSI
Crypto
XAUUSD
ATR
cTrader Storeで入手可能な取引ボット、インジケーター、プラグインなどの商品は、第三者の開発者が提供するものであり、情報と技術の取得のみを目的としてご利用いただけます。cTrader Storeはブローカーではなく、投資助言や個人的な推奨を行うことも、将来のパフォーマンスを保証することもありません。


価格
登録日 03/10/2024
163
販売
37.91K
無料インストール