
Volume POC Heatmap
インジケーター
3.34K ダウンロード数
バージョン 1.0、Feb 2025
Windows、Mac
5.0
レビュー: 4

説明
Pinescriptlabs ストアのインジケーター: Pinescriptlabs ストアのcBots : (cBot) Gold & BTC ブレイクアウトセッションピボット(新着)
高度なマーケット構造:Bos、Choch、SwinLevels、オーダーブロック、 マーケット構造&流動性ファインダー(新着)
トレーリングスマートアルゴリズム (新着)
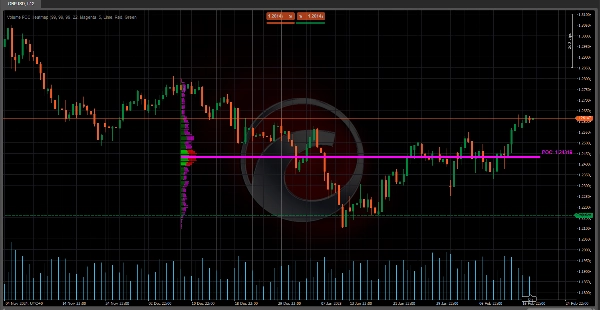
🔥 ボリュームPOCヒートマップ 🔥
このインジケーターは ボリュームプロファイル であり、特定の期間中に異なる価格レベルで取引された出来高の分布を表示します。主な目的は、重要な サポート/レジスタンスゾーン および市場が最も関心を示したエリア(高い買い/売り活動)を特定することです。以下の用途に非常に役立ちます:
- コントロールポイント(POC)の検出 🎯
最も高い出来高を持つ価格レベルで、価格アクションの磁石として機能します。 - バリューエリア(VA)の視覚化
総出来高の特定の割合(例:70%)が集中するゾーンで、買い手と売り手のバランスを示します。 - 強気と弱気の出来高の区別 📈📉
買い圧力と売り圧力がどこに蓄積しているかを示します。
🧠 主要なロジック&計算 🔢
- 価格範囲の分割 📏
-
- 価格範囲(過去 B本のバー の最低値から最高値まで)が ボリュームセル(CNum) に分割されます。
例:もし CNum = 33 なら、範囲は33の等間隔レベルに分割されます。
- 価格範囲(過去 B本のバー の最低値から最高値まで)が ボリュームセル(CNum) に分割されます。
- レベルごとの出来高分布 📊
-
- 履歴データの各バーについて:
-
- ボディ(始値と終値の差)とヒゲ(高値と安値)に関連する出来高を計算します。
- 出来高はバーが交差する価格セルに比例配分されます。
例:緑(強気)バーが3つのセルをカバーする場合、出来高は主にそれらのセルに「強気の出来高」として割り当てられます。
- コントロールポイント(POC)計算 🎯
-
- POCは最も累積出来高の多いセルで、買い手と売り手の間で最も合意があった価格を表します。
- バリューエリア(VA)計算 🔄
-
- POCから上下に拡大し、指定された総出来高の%(例:70%)を含むまで範囲を広げます。
例:VAが 100から105 の範囲であれば、その範囲内で70%の出来高が取引されたことを意味します。
- POCから上下に拡大し、指定された総出来高の%(例:70%)を含むまで範囲を広げます。
- 視覚的正規化 🖼️
-
- 出来高は スケールファクター を使ってスケーリングされ、チャート上のバーの幅を調整し、視覚化を容易にします。
🛠️ ボリュームPOCヒートマップのキー 💡
- 従来の出来高インジケーターの文脈の欠如 🤔
従来の出来高インジケーター(バーごとの出来高など)は、どこで出来高が取引されたかを示しません。このインジケーターは価格レベルごとに出来高をマッピングし、その問題を解決します。 - 有機的なサポート/レジスタンスの識別 🚀
高い出来高のゾーンは動的なサポート/レジスタンスとして機能し、静的なラインよりも信頼性があります。 - アンバランスの検出 ⚖️
主に強気または弱気の出来高が優勢なエリアは、潜在的なブレイクアウトや反転を示唆します。
💡 トレーディングにおける実用的な使用法 📈
- 関心ゾーンとしてのPOC 🎯
-
- 価格がPOCに近づく場合、反発や統合の反応が予想されます。
- バリューエリア(VA)としてのバランスゾーン 🔄
-
- 価格がVAの外にある場合、戻る傾向があります(磁石効果)。
- 価格がVAの内側にある場合、統合を示す可能性があります。
- 確認としての強気/弱気出来高 🔍
-
- レジスタンスでの強気出来高の急増は潜在的なブレイクアウトを示唆します。
- サポートでの高い弱気出来高は可能なブレイクダウンを示します。
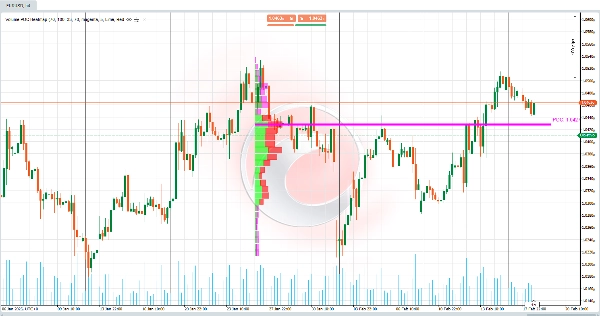
🌟 例 📊
使用されるパラメーター(ユーザーが表示および設定可能):
- バーの数 = 55 → 分析される過去のバーの数。
- ボリュームセル = 33 → 価格範囲の分割数/セル数。
- バリューエリア出来高% = 70 → バリューエリアを定義する出来高の割合。
状況:
- 価格がテクニカルサポートレベルを突破しますが、そのゾーンの出来高は低い(プロファイルによる)。
- 後に価格は バリューエリア(VA) (総出来高の70%で定義)に戻ります。
解釈:
- ブレイクアウトは偽であった(ブレイクアウトゾーンの出来高が低いため)。
- 市場は バリューエリア 内で再均衡を求めており、そこにはより高い活動(高い出来高密度)があります。
行動:
- VAの下限またはPOC付近で買いの機会を探してください。これらは市場参加者にとって高い関心のゾーンです。
概要
AIによる概要
Volume POC Heatmap is a volume profile indicator that visualizes the distribution of traded volume across price levels over a specified historical period. It identifies key market areas such as the Point of Control (POC)—the price level with the highest traded volume—and the Value Area (VA), which encompasses a configurable percentage (e.g., 70%) of total volume, indicating zones of buyer-seller balance. The indicator differentiates bullish and bearish volume by distributing volume proportionally across price cells intersected by each bar, highlighting areas of buying power versus selling pressure.
Key functionalities include:
- Division of the price range into multiple volume cells for detailed volume mapping.
- Calculation of POC as the volume consensus price.
- Determination of the Value Area around the POC.
- Visual normalization of volume bars for clearer chart representation.
This tool addresses the limitation of traditional volume indicators by showing where volume was traded rather than just total volume per bar. It helps identify dynamic support and resistance zones based on volume concentration and detects volume imbalances that may signal potential breakouts or reversals. Traders can use it to anticipate price reactions near the POC and VA, aiding in decision-making for entries and exits. Configurable parameters include the number of historical bars analyzed, volume cells, and the percentage defining the Value Area.
インジケーターのプロフィール
カスタマーレビュー
5.0
レビュー: 4
5 | 100 % | |
4 | 0 % | |
3 | 0 % | |
2 | 0 % | |
1 | 0 % |
カスタマーレビュー
September 7, 2025
Me gusta por la forma en que representa los datos, un poco molesto con el parpadeo, pero es soportable. 😀
July 9, 2025
Pros: Visualizes volume concentration and POC zones as a heatmap. Helps spot high-interest price levels. Stable performance, easy to use. Cons: No tooltips or alerts. Limited customization for transparency and color. Requires other tools for precise trading signals.
June 22, 2025
ディスカッション
よくあるご質問
BTCUSD
Signal
Breakout
Supertrend
Commodities
RSI
Crypto
XAUUSD
ATR
cTrader Storeで入手可能な取引ボット、インジケーター、プラグインなどの商品は、第三者の開発者が提供するものであり、情報と技術の取得のみを目的としてご利用いただけます。cTrader Storeはブローカーではなく、投資助言や個人的な推奨を行うことも、将来のパフォーマンスを保証することもありません。


![「[Stellar Strategies] Market Session Ultimate」ロゴ](https://cdn.ctrader.com/image/webp/61ffd537-0125-4246-9e72-42eca1791d64_28232)


価格
登録日 03/10/2024
163
販売
38.01K
無料インストール