
説明
🚀 10,000人以上のトレーダーがすでに私たちのトップ インジケーター🏆 を使用しています
なぜプロが私たちを選ぶのかを発見してください – 最も強力なツールが cTrader(インジケーター、アルゴリズム、cBots)であなたを待っています。
👉 すべてのトップシステムはこちらから入手できます:
_______________________________________________
📌 マーケット構造インジケーター
· ✅ AdvancedMarket Structure: Bos, Choch, SwinLevels, Order Blocks, Market Structure&流動性ファインダー
· 🧱 オーダーブロック
· ⚖️ マーケットアンバランス
· ⛓️ BOS&CHOCH
· 🧠 ICTパワーオブ3
· 🌀 マーケットポラリティゾーン
_______________________________________________
🔚 スマートエグジットシステム
· 📍 トレーリングスマートアルゴリズム
_______________________________________________
📐 ジグザグインジケーター
· 🔍 ジグザグ価格流動性予測
· 🧭 S&R構造ジグザグ
· ➖ ジグザグ
· 🎯 ジグザグ極端トラッカー
_______________________________________________
🧱 サポート&レジスタンスインジケーター
_______________________________________________
📊 トレンド&チャネルインジケーター
· 🔄 オートトレンドチャネル
· 📊 スーパートレンド
· 🧠 アダプティブトレンドチャネル
· 💥 チャネルブレイクアウトシステム
· ⭐ プレミアムSSLチャネル
· 🔁 リアクティブ移動平均
_______________________________________________
💧 ボリューム&流動性ツール
· 🔥 ボリュームPOCヒートマップ
· 📉 レバレッジ清算マップ
· 🔍 モメンタムフェアバリューギャップ
· 🕒 フェアバリューギャップセッション
_______________________________________________
⚡ モメンタム&RSIインジケーター
· 📈 RSIトレンドトリガー
· 🚀 ダイナミックレンジモメンタム
_______________________________________________
🔮 予測&投影ツール
· 📐 Linreg&ATRに基づく予測
🟢 オーダーブロックの識別 🔴
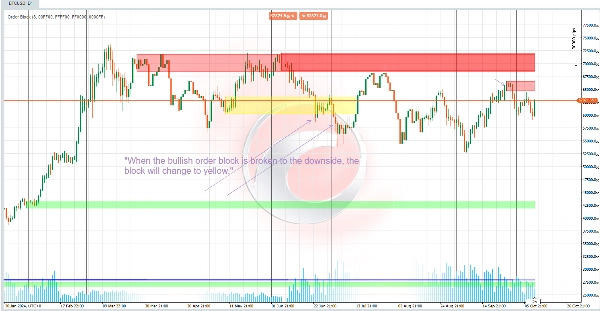
**強気のオーダーブロック 🚀:**
強気のオーダーブロックを見つけるには:
- コードは現在の終値が以前のスイングの最高点を超えているかどうかをチェックします ⬆️。
- もしそうで、そのスイングがまだクロスされていなければ、クロス済みとしてマークされます。オーダーブロックは前のローソク足の最安値から最高値までで定義されます 📈。
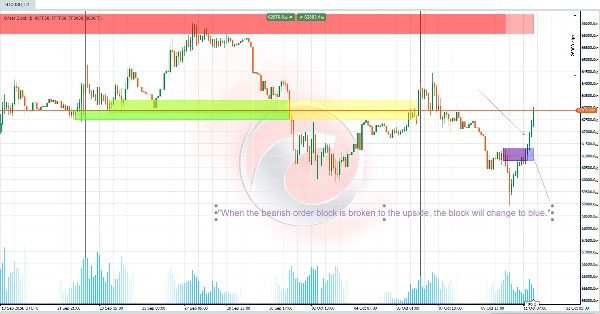
**弱気のオーダーブロック 🔻:**
- これは同様に機能しますが、低価格のスイングに適用されます。
- 現在の終値がスイングの最安値を下回ると、弱気のオーダーブロックが作成されます ⬇️。
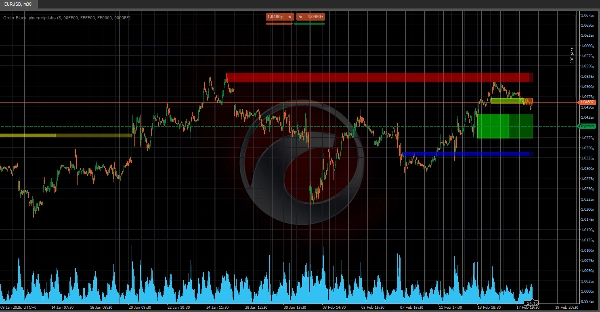
### 💼 オーダーブロックの機能 📊
オーダーブロックは、**大口市場参加者が大きく取引した可能性のある高ボリュームの蓄積ゾーン**を表します
これらのエリアはしばしば潜在的なサポートまたはレジスタンスレベルとして機能し、トレンドの継続または反転のシグナルとなることがあります 📉📈。
- **サポートまたはレジスタンス:** 壊れたオーダーブロックは、前のトレンドに応じて関連するサポートまたはレジスタンスエリアを示すことがあります 🔄。
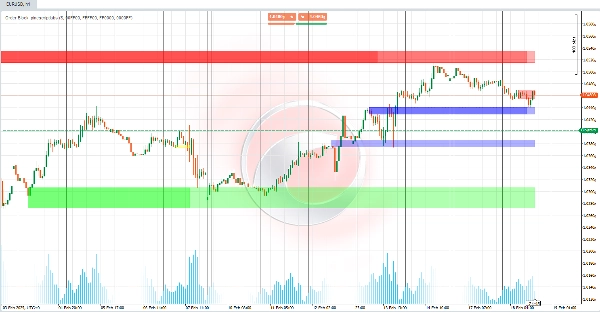
- **継続または反転:**
- 反対方向へのオーダーブロックの破壊は潜在的な反転を示すことがあります 🔄。
- 同じ方向への破壊はトレンドの継続を確認することができます 🔗。
このインジケーターは、**チャート上の重要なレベルを特定するのに強力**であり、トレーダーが高ボリュームゾーンの価格動向に基づいて重要なエリアを視覚化するのに役立ちます。トレンドや市場の動きを見つけるのに最適です! 🎯📊
概要
カスタマーレビュー
5 | 100 % | |
4 | 0 % | |
3 | 0 % | |
2 | 0 % | |
1 | 0 % |


