
Descrizione
Pinescritlabs
Indicatori Ctrader Store: 🤖Pinescritlabs Ctrader Store cBots:
Fair Value Gap Sessions Gold & BTC Breakout Session Pivots(new)
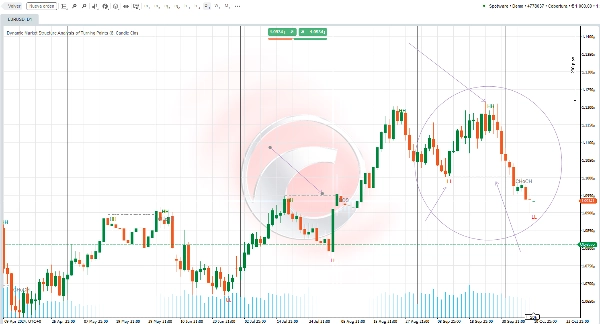
Dynamic Market Structure
Analisi dei Punti di Inversione
Fibonacci Linear
Regressione Multi-timeframe
Multi-Level Candle Bias
Tracker
Auto Support and
Resistance Trend Lines
All Support and
Resistance Levels
Panoramica delle Impostazioni dell'Indicatore 🌟
LUNGHEZZA DELLO SWING 📏
Questo parametro determina quante barre vengono considerate a sinistra e a destra durante la ricerca dei punti di swing. Un valore più basso mostrerà più punti, mentre un valore più alto ne ridurrà la quantità. Si consiglia di regolare questo parametro in base al proprio stile di trading e quando si passa tra diversi timeframe.
CHOCH 🔄
Abilitando questa opzione, il primo breakout contro-tendenza verrà rinominato CHoCH (Change of Character), indicando così un possibile cambiamento nella direzione del mercato.
HH e LL 📈📉
L'indicatore traccerà i punti di massimo swing (HH) e i punti di minimo swing (LL) sul grafico, permettendoti di visualizzare la struttura del mercato in modo più efficace.
BOS ⚡
L'indicatore mostrerà anche i livelli di Break of Structure (BOS) quando rileva breakout nei punti di swing, fornendo ulteriori informazioni sulla dinamica del mercato.
Riepilogo
Recensioni dei clienti
5 | 33 % | |
4 | 67 % | |
3 | 0 % | |
2 | 0 % | |
1 | 0 % |


