


Beschreibung
Beschreibung:
Session VWAP Bänder zeichnet einen volumengewichteten Durchschnittspreis auf, der an Ihre gewählte Sitzung (standardmäßig täglicher Reset) angehängt ist, zusammen mit drei Stufen statistischer Abweichungsbänder — dasselbe Fair-Value-Rahmenwerk, das an institutionellen Aktien- und Futures-Desks verwendet wird, nun für den Einzelhandels-Forex- und CFD-Chartbereich verfügbar.
Was es analysiert: jeden typischen Preis jeder Kerze (hoch+tief+schluss ÷ 3), gewichtet nach Volumen, akkumuliert ab Sitzungsbeginn. Daraus werden der laufende VWAP und die Standardabweichung des Preises um diesen berechnet, dann werden 1σ-, 2σ- und 3σ-Bänder ober- und unterhalb projiziert.
Wie man es liest:
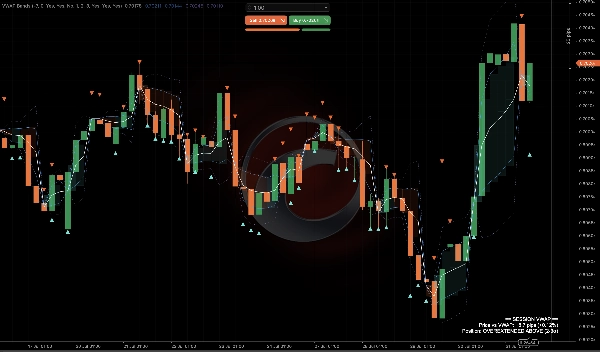
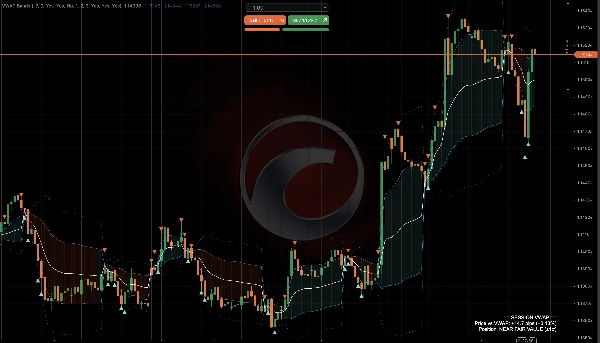
- Die weiße VWAP-Linie ist der volumengewichtete Fair Value der Sitzung — ein Preis darüber bevorzugt Käufer für die Sitzung, darunter bevorzugt Verkäufer.
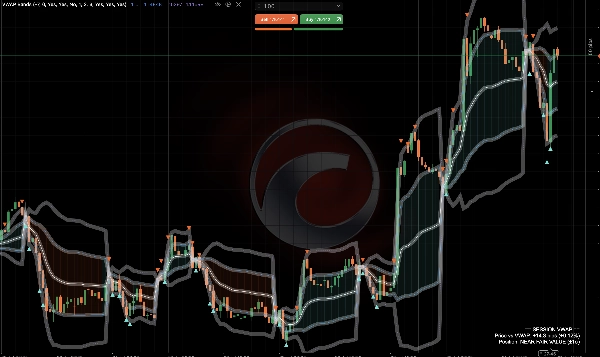
- Die inneren Bänder (1σ, durchgezogen) markieren den normalen Handelsbereich um den Fair Value.
- Die äußeren Bänder (2σ/3σ, gepunktet) markieren statistisch gedehnte Zonen — der Preis verbringt selten lange Zeit außerhalb dieser ohne Umkehr oder Auslösung einer starken Trendfortsetzung.
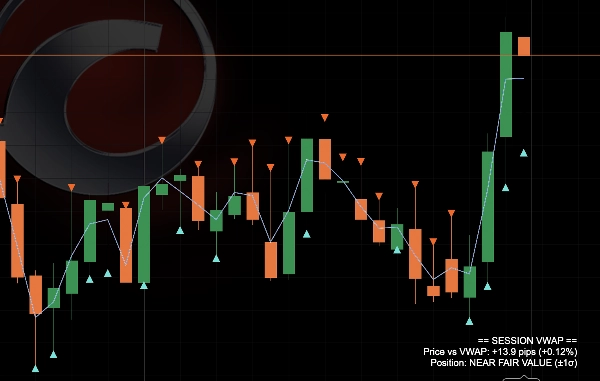
- Eine weiche Farbverlaufswolke schattiert den Bereich zwischen Preis und dem ersten Band und ändert die Farbe je nachdem, auf welcher Seite des VWAP der Preis gehandelt wird — eine schnelle visuelle Einschätzung der Sitzungs-Bias.
- Kleine Dreieck-Marker erscheinen automatisch, wenn der Preis über das zweite Abweichungsband hinaus ausschlägt und wieder innerhalb schließt — ein Signal für potenzielle Mittelwertumkehr an einem Extrem.
- Das Panel in der Ecke gibt eine Live-Lesung in einfachem Englisch: Abstand vom VWAP in Pips und %, plus eine Zonenbezeichnung wie „ÜBERDEHNT OBEN (2-3σ).“
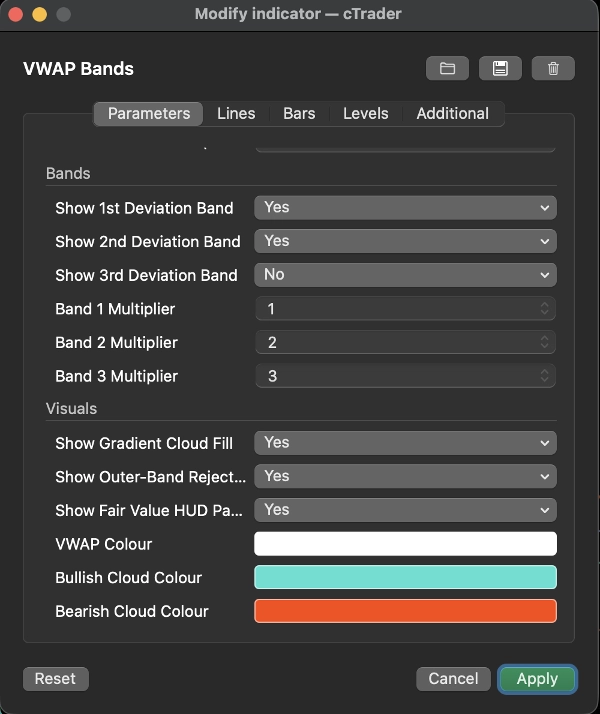
Wichtige Einstellungen: Sitzungs-Reset-Zeit (mit einem Serverzeit-zu-NY-Offset für genaue tägliche Resets), unabhängige Ein-/Aus-Schalter und benutzerdefinierte Multiplikatoren für jede der drei Bandstufen, Wolkenfüllung und Ablehnungsmarker-Schalter sowie vollständige Farb-Anpassung.
Typische Anwendungsfälle: Beurteilung des intraday Fair Value bei Indizes, Forex-Majors und Gold; das Zurückziehen von ausgedehnten Bewegungen zurück zum VWAP, wenn der Preis die äußeren Bänder berührt; Verwendung des VWAP als dynamische intraday Unterstützung/Widerstand; Bestätigung, ob ein Ausbruch von einem „gedehnten“ oder „Fair Value“-Ausgangspunkt erfolgt.
Am besten geeignet für: Intraday- und Scalping-Trader, die eine objektive, statistisch fundierte Einschätzung des Fair Value wünschen statt einer statischen Linie — nützlich sowohl für diskretionäre Bias-Bildung als auch als Konfluenz-Werkzeug neben anderen Setups. Weniger relevant für reine langfristige Positions-Trader.
Zusammenfassung
The indicator calculates each bar’s typical price (average of high, low, and close) weighted by volume from the session start, deriving the running VWAP and standard deviation. The white VWAP line represents the session’s fair value, with price above favoring buyers and below favoring sellers. The inner bands mark normal trading ranges, while outer bands indicate statistically stretched price zones that often precede reversions or strong trend continuations.
Visual features include a gradient cloud shading between price and the first band, changing color based on price position relative to VWAP, and triangle markers signaling price rejection beyond the second deviation band, suggesting potential mean reversion. A corner panel displays live metrics such as distance from VWAP in pips and percentage, plus zone labels like "OVEREXTENDED ABOVE (2-3σ)."
Key settings allow customization of session reset time, band multipliers, cloud and marker toggles, and colors. VWAP Bands is suited for intraday and scalping traders seeking an objective, statistically grounded measure of fair value and dynamic support/resistance.
Diskussion
Kundenbewertungen
Häufig gestellte Fragen (FAQ)
Mehr von diesem Autor


























![„[Stellar Strategies] MARSI Signal Plotter“-Logo](https://cdn.ctrader.com/image/webp/7b2b8da6-8f8e-4646-8d4a-4710c516c01e_25567)


Preis