
Order Block with Volume
Indicator
7 purchases
Version 1.0, Mar 2026
Windows, Mac
5.0
Reviews: 1
Description
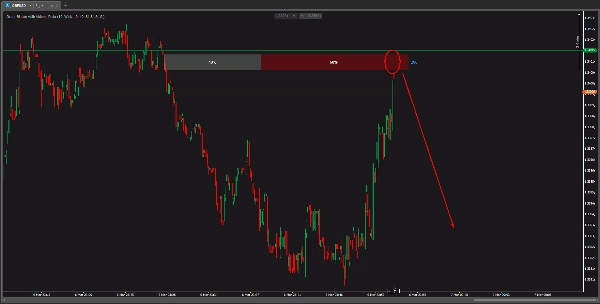
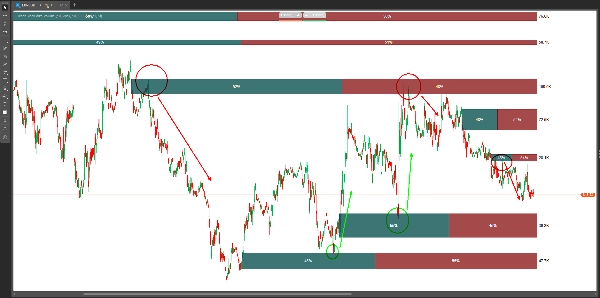
Order Blocks with Volume Delta 💎
This advanced indicator identifies supply and demand zones by analyzing the institutional intent behind every move. Using pure price action and volume metrics, it highlights exactly where the "Smart Money" is positioned. It is a universal tool designed to perform on any asset (Forex, Indices, Crypto, Commodities) across all timeframes.
The Execution Strategy: Mastering the Entry 🎯
To maximize the indicator’s precision and hit high-RR targets, follow these professional execution rules:
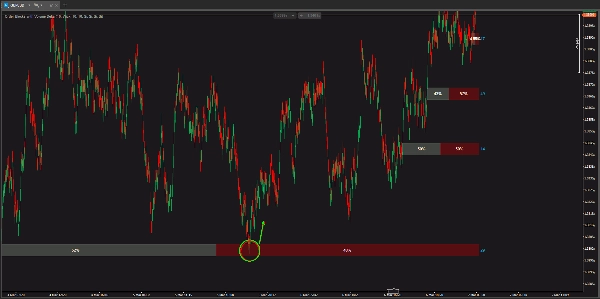
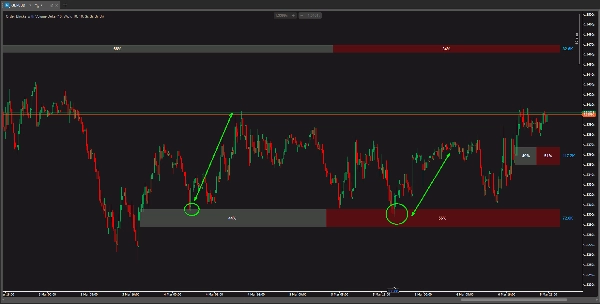
- The Entry (Execution): Do not enter blindly. Wait for the price to return to the marked zone (mitigation). The ideal entry occurs at the 50% of the Order Block (Mean Threshold) or at the beginning of the zone if the Volume Delta shows aggressive dominance (above 70%).
- Stop Loss (SL) Placement: For solid protection, place your SL 2-3 pips/ticks beyond the outer limit of the Order Block. This provides enough "breathing room" against liquidity sweeps.
- Risk-to-Reward (RR) Management: * Target Ratio: Always aim for a minimum of 1:3.
- Elite Potential: By refining entries on lower timeframes (M1/M5) inside a higher timeframe (H1/H4) Order Block, it is entirely possible to achieve ratios of 1:10. This allows you to risk 1% of your account to gain 10% in a single move.
High-Probability Confluences (The 1:10 Formula) 🚀
- HTF Alignment: Only trade Order Blocks that align with the trend of a Higher Timeframe (HTF).
- Volume Confirmation: Look for a Volume Delta spike (intense color) when the price first creates the block. This confirms institutional participation.
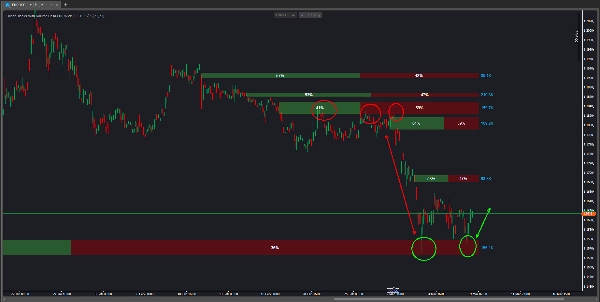
- Liquidity Sweeps: The best trades happen after the price has "hunted" previous highs or lows before slamming into your Order Block.
How does it work? 🛠️
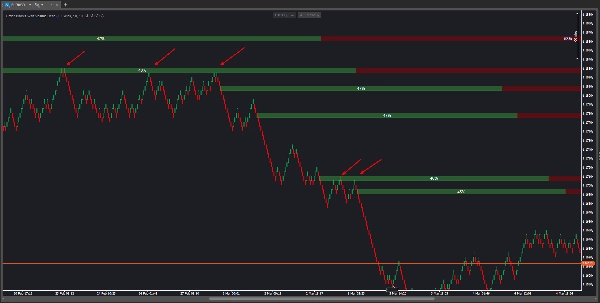
- Structure Detection: Identifies pivots (Swing High/Low) to detect the Break of Structure (BOS).
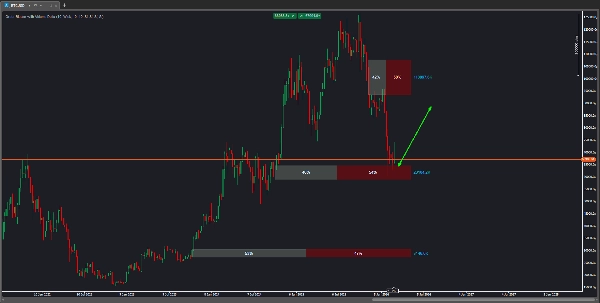
- Block Creation: Automatically marks the Order Block zone after a significant institutional move.
- Volume Delta Analysis: Breaks down total volume into buy vs. sell percentages to confirm strength.
- Dynamic Management: Zones remain active until they are mitigated by price or invalidated.
Key Features ✨
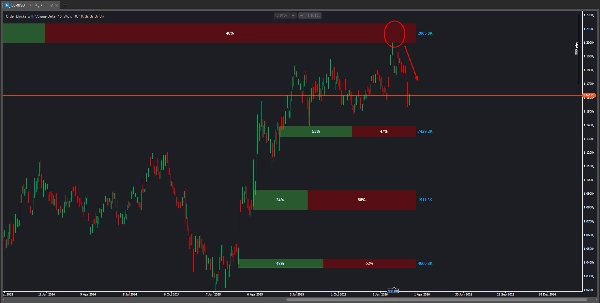
- 📊 Volume Delta: Visualize the actual dominance of buyers or sellers within the zone.
- 💰 Volume Metrics (K): Displays total accumulated volume (e.g., 82.6K) to gauge the zone's institutional weight.
- 🛡️ Invalidation Filter: Choose if a zone is broken by a wick touch or a candle close.
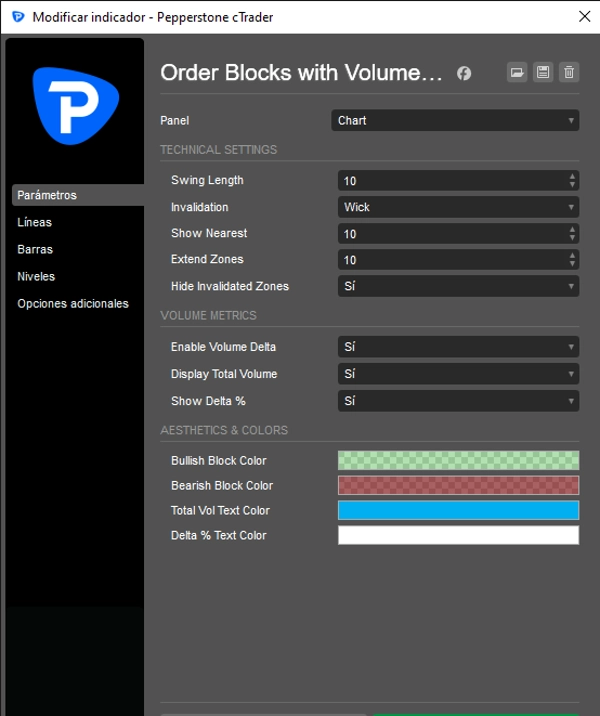
Step-by-Step Configuration ⚙️
- Swing Length: Adjust structure sensitivity (recommended value: 10).
- Invalidation: Select Wick or Candle Close to define zone validity.
- Volume Metrics: Enable "Display Total Volume" to visualize institutional strength in real-time.
Trial Version ⏳
- 🔓 Full Features: The trial version includes all calculation tools for a complete evaluation.
- 🕒 Duration: This demo version will be active for a period of 7 days.
- 🏢 Account Restriction: Limited strictly to Demo Accounts for testing and practice purposes.
Summary
Indicator profile
Customer reviews
5.0
Reviews: 1
5 | 100 % | |
4 | 0 % | |
3 | 0 % | |
2 | 0 % | |
1 | 0 % |
Customer reviews
March 27, 2026
The signal still needs a chart check, no surprise there. Overconfidence is the real danger.
Discussion
FAQ
Forex
Indices
Commodities
Fair Value Gap
SMC
Crypto
Products available through cTrader Store, including trading bots, indicators and plugins, are provided by third-party developers and made available for informational and technical access purposes only. cTrader Store is not a broker and does not provide investment advice, personal recommendations or any guarantee of future performance.


Price
Since 05/05/2025
7
Sales