

HIGHS LOWS AEGIS
Indicator
1 purchases
Version 1.0, Dec 2025
Windows, Mac
4.6
Reviews: 3
Since 14/04/2025
1
Sales
Description
Simple indicator which shows chosen Highs and Lows.
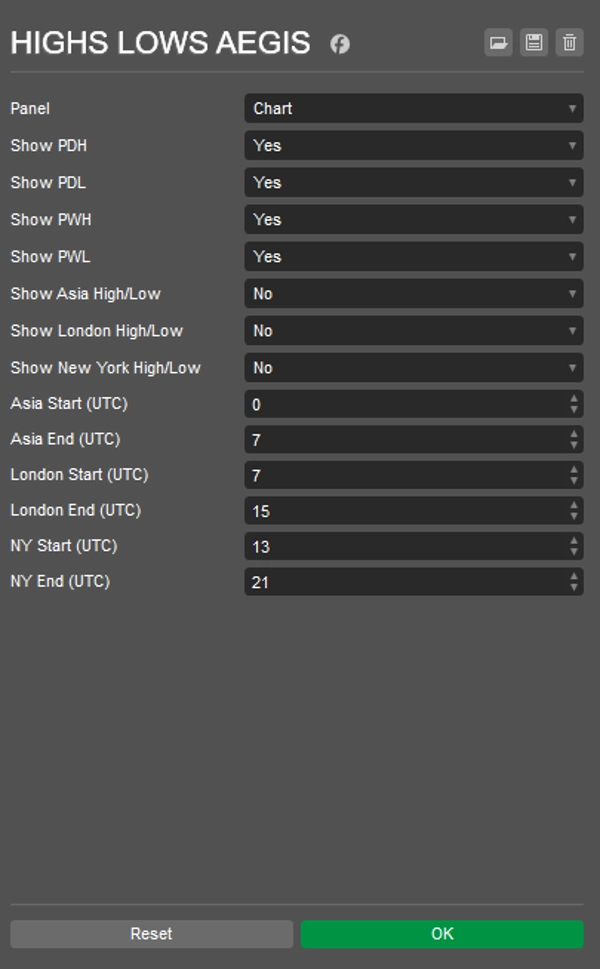
- Previous Day Low/High
- Previous Week Low/High
- Asia/London/New York sessions Low/High
- Customizable UTC time for every session start/end
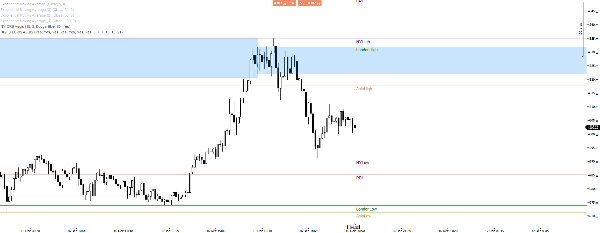
Labeled lines for better seeing what is what.
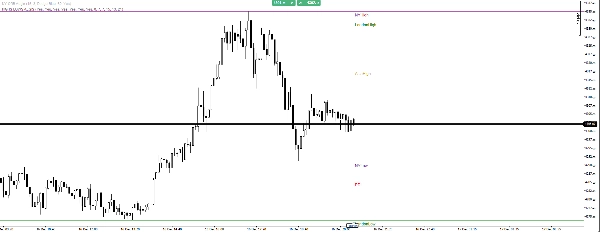
Good use with almost any strategy, Im using it with ORB, which greatly helps to avoid fake breakouts, like in picture today with XAUUSD.
Summary
AI summary
HIGHS LOWS AEGIS is a trading indicator that displays selected high and low price levels on a chart. It shows Previous Day Low/High, Previous Week Low/High, and session-specific lows and highs for Asia, London, and New York trading sessions. Users can customize the UTC start and end times for each session. The indicator features labeled lines to clearly identify each level. It is designed to be compatible with various trading strategies, including opening range breakout (ORB), and can assist in identifying potential breakout points and avoiding false breakouts. The indicator supports multiple markets such as Forex, commodities, indices, and stocks, and is applicable to symbols including EURUSD, XAUUSD (gold), and NAS100 (Nasdaq 100).
Indicator profile
Customer reviews
4.6
Reviews: 3
5 | 67 % | |
4 | 33 % | |
3 | 0 % | |
2 | 0 % | |
1 | 0 % |
Customer reviews
December 27, 2025
December 24, 2025
weak ideas are easier to skip, but it should stay in the support stack.
December 21, 2025
Discussion
FAQ
Prop
Forex
Breakout
Scalping
Indices
EURUSD
Commodities
SMC
Stocks
XAUUSD
NAS100
Products available through cTrader Store, including trading bots, indicators and plugins, are provided by third-party developers and made available for informational and technical access purposes only. cTrader Store is not a broker and does not provide investment advice, personal recommendations or any guarantee of future performance.


















Price
Since 14/04/2025
1
Sales