
Description
Overview
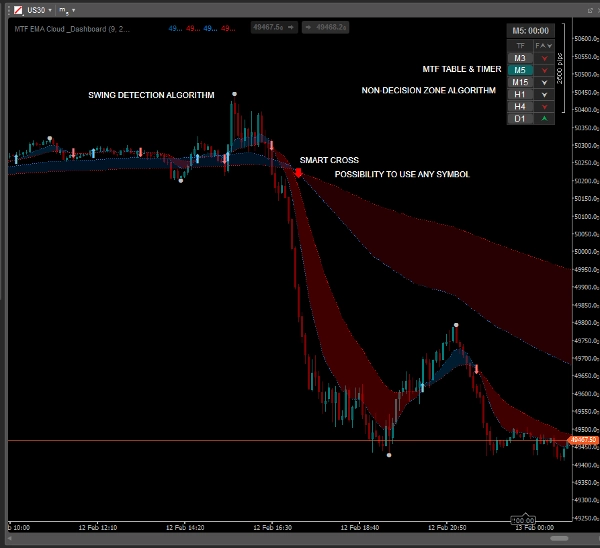
Stop guessing the market direction. EMA MTF Cloud & Dashboard is a comprehensive trend-following toolkit designed for scalpers and day traders. It combines the smoothness of Exponential Moving Averages with the power of Multi-Timeframe analysis, all in one clean chart interface.
Unlike standard indicators, this tool includes a Smart Neutral Zone logic to filter out choppy markets, saving you from false signals during flat periods.
Key Features
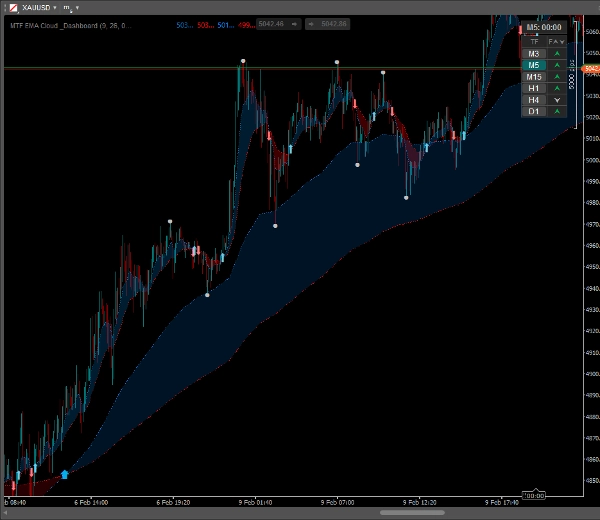
✅ Dynamic EMA Clouds
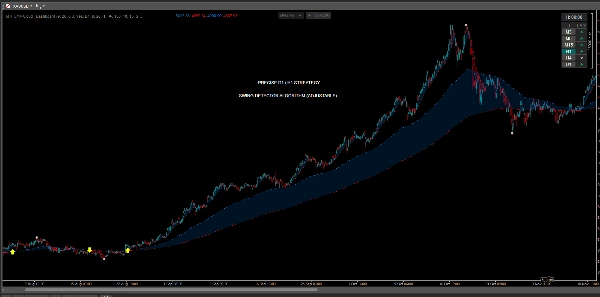
Visualize the trend instantly. The space between Fast and Slow EMAs is filled with a semi-transparent cloud, making it easy to identify trend strength and potential support/resistance zones.
✅ MTF Overlay (Multi-Timeframe)
See the "Big Picture" without switching charts. Display higher timeframe EMAs (e.g., H1) directly on your lower timeframe chart (e.g., M5).
- Includes separate crossover arrows for the MTF trend!
✅ Smart Trend Dashboard
A compact, clickable table showing the trend status for 6 timeframes (M3 to Daily).
- Neutral Zone Logic: The dashboard detects flat markets (consolidation) and marks them in gray/silver, helping you stay out of bad trades.
- Interactive: Click on any Timeframe button in the table to instantly switch the chart.
✅ Swing High / Swing Low Points
Automatically marks significant local tops and bottoms. Perfect for placing Stop Loss orders or identifying Take Profit levels based on recent price structure.
✅ Visual Crossover Signals
Clear, customizable arrows appear exactly when the EMA Fast crosses the EMA Slow.
- Customize colors, sizes, and arrow styles.
✅ Candle Timer
A built-in countdown timer shows exactly how much time is left until the candle closes, essential for timing your entries.
How to Trade (Strategy Example)
- Check the Dashboard: Ensure higher timeframes (e.g., H1, H4) are matching (Green/Red). Avoid trading if they show "Neutral" (Gray).
- Wait for the Signal: Look for a crossover arrow in the direction of the main trend.
- Confirm with Price Action: Use the "Swing High/Low" dots to confirm market structure.
- Enter & Manage: Enter on the candle close. Use the EMA Cloud as dynamic support for trailing your stop loss.
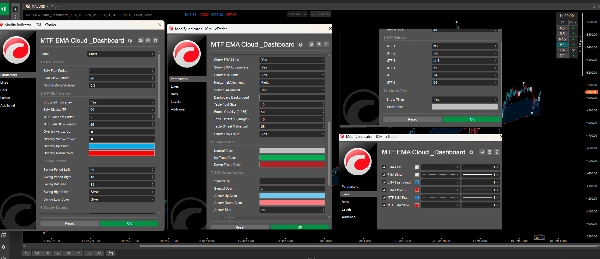
Customization
The indicator is highly customizable to fit your style:
- Adjust EMA periods for both current and MTF modes.
- Change colors for Clouds, Arrows, Swings, and the Dashboard.
- Configure the Dashboard position and transparency.
- Toggle any feature On/Off independently.
Summary
Customer reviews
5 | 0 % | |
4 | 100 % | |
3 | 0 % | |
2 | 0 % | |
1 | 0 % |


