present
Sign up and get $50 off your first purchase
Trading product for MACD  -  advanced Indicator BTCUSD Forex, image 1
MACD - advanced
Indicator
5 purchases
Version 1.0, Mar 2026
Windows, Mac
4.3
Reviews: 6
Trading product for MACD  -  advanced Indicator BTCUSD Forex, image 2
Trading product for MACD  -  advanced Indicator BTCUSD Forex, image 3
Trading product for MACD  -  advanced Indicator BTCUSD Forex, image 4
Trading product for MACD  -  advanced Indicator BTCUSD Forex, image 5
Trading product for MACD  -  advanced Indicator BTCUSD Forex, image 6
Trading product for MACD  -  advanced Indicator BTCUSD Forex, image 7
Trading product for MACD  -  advanced Indicator BTCUSD Forex, image 8
29
Sales
808
Free installs

Description

MACD Advanced — Indicator Description

MACD Advanced is a professional upgrade of the classic MACD indicator for cTrader. It combines the standard MACD logic with a rich set of visual tools and analytical layers, giving traders a much deeper view of market momentum, trend strength, and volatility conditions — all in one panel.


Histogram with Momentum Coloring

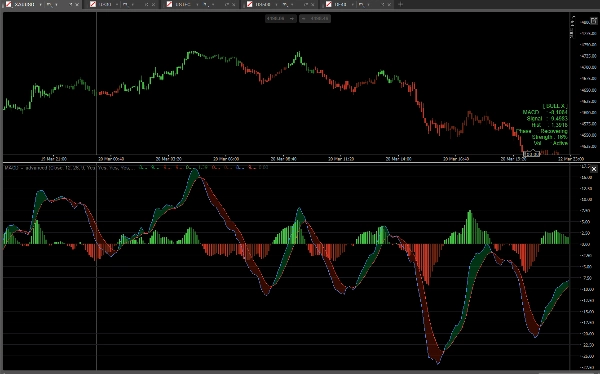
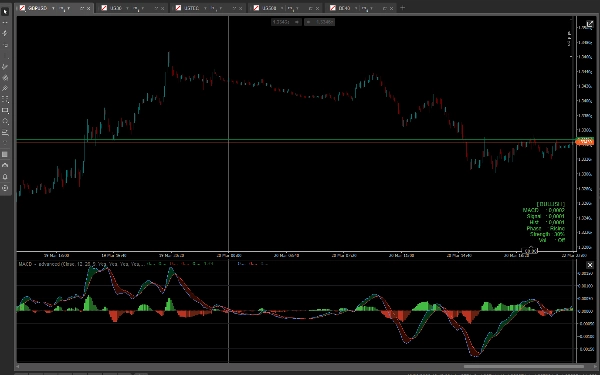
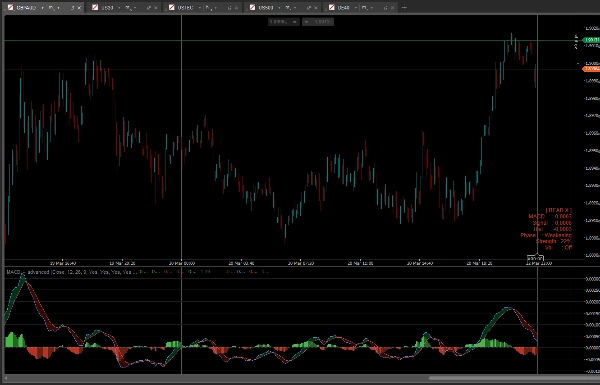
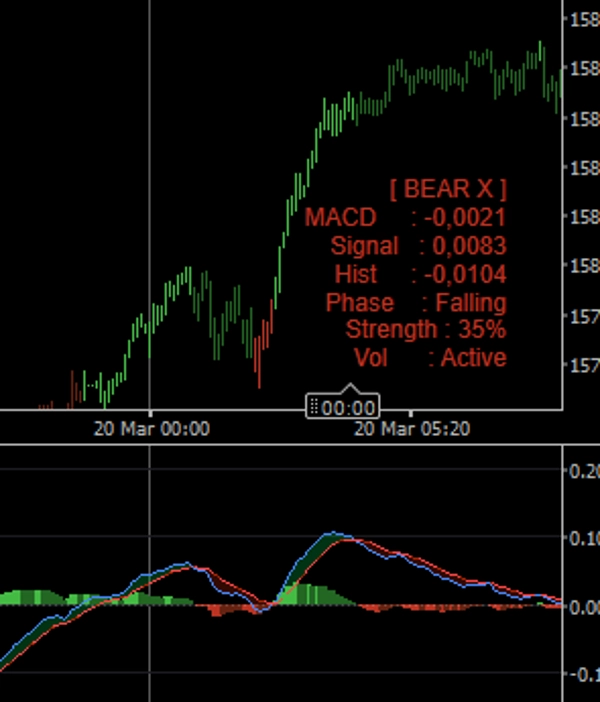
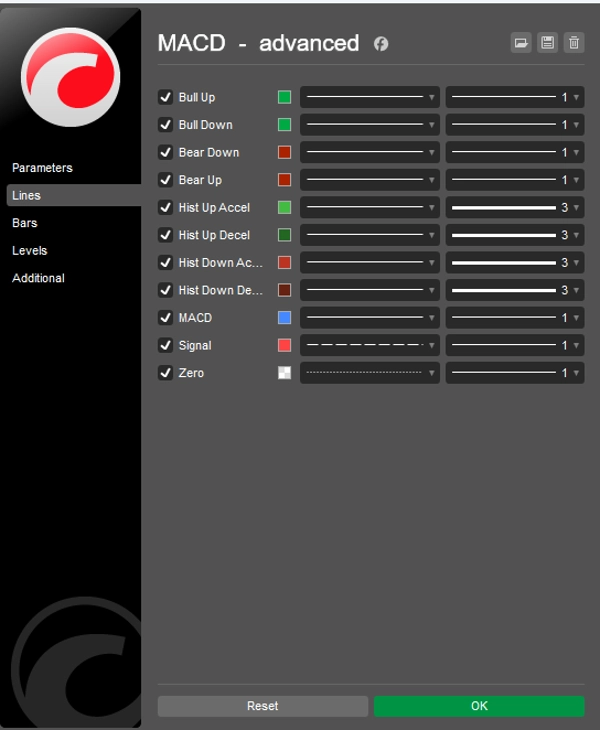
The histogram displays the difference between the MACD and Signal lines and uses four separate colors to distinguish between four market states: bullish accelerating, bullish decelerating, bearish accelerating, and bearish decelerating. This makes it immediately clear whether momentum is building or fading, without any manual calculation.


MACD Cloud

An optional cloud fills the area between the MACD and Signal lines. A green cloud forms when MACD is above Signal (bullish bias), and a red cloud when MACD is below Signal (bearish bias). The cloud gives an instant visual read of trend direction at a glance.


Trend Strength

The indicator calculates a real-time trend strength score based on the separation between the MACD and Signal lines over a configurable lookback period. The result is displayed as a percentage in the info table, helping you gauge how strong or weak the current move is.


Volatility Filter

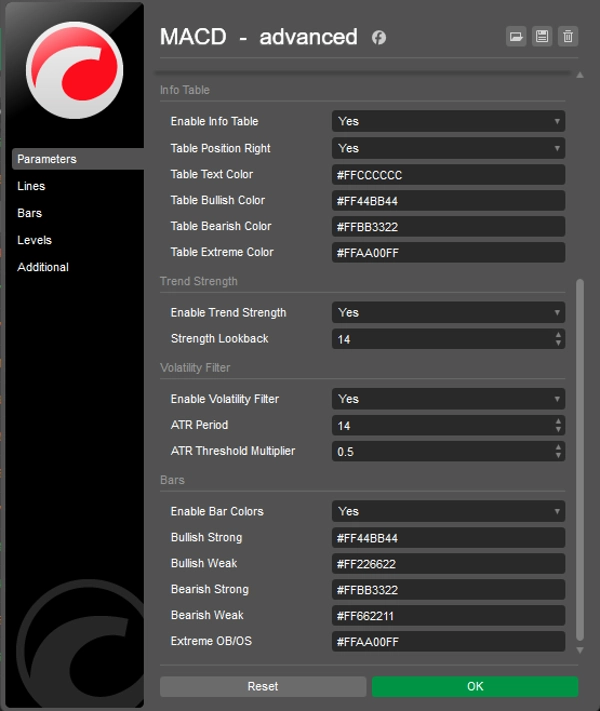
An optional ATR-based volatility filter suppresses signals during low-volatility periods. When enabled, histogram bars and bar colors change to a neutral grey when volatility falls below a configurable threshold, preventing false readings in quiet markets.


Info Table

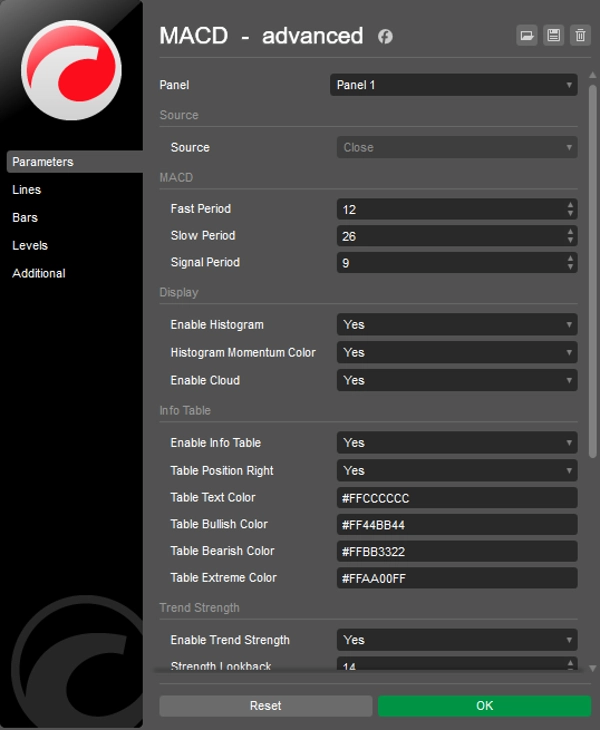
A compact on-chart table displays the current market state (Bullish, Bearish, Bull Crossover, Bear Crossover, Neutral), exact MACD and Signal values, histogram value, cycle phase (Rising, Weakening, Recovering, Falling), trend strength percentage, and volatility filter status. The table position (left or right) and all colors are fully configurable.


Bar Coloring

When enabled, the indicator recolors chart candles based on MACD conditions: strong bullish, weak bullish, weak bearish, strong bearish, and low volatility. This brings the MACD signal directly onto the price chart without switching panels.


Key Features Summary

  • Four-color momentum histogram
  • MACD cloud between MACD and Signal lines
  • Real-time trend strength score in percent
  • ATR-based volatility filter with visual feedback
  • On-chart info table with full market state breakdown
  • Optional candle coloring based on MACD conditions
  • All colors fully customizable with alpha channel support
  • Clean and lightweight — no repainting

Summary

AI summary
MACD Advanced is a professional indicator for cTrader that enhances the classic MACD by integrating multiple visual and analytical tools into a single panel. It provides a detailed view of market momentum, trend strength, and volatility. Key features include a four-color momentum histogram that distinguishes between bullish and bearish acceleration or deceleration, and an optional MACD cloud that visually indicates trend direction by shading the area between the MACD and Signal lines in green or red. The indicator calculates a real-time trend strength score as a percentage based on the MACD and Signal line separation over a configurable period. An optional ATR-based volatility filter suppresses signals during low-volatility phases by changing histogram colors to neutral grey, reducing false signals. A compact on-chart info table displays current market state, MACD and Signal values, histogram data, cycle phase, trend strength, and volatility filter status, with customizable position and colors. Additionally, candle bars can be recolored based on MACD conditions to reflect strong or weak bullish/bearish trends and low volatility directly on the price chart. All colors support alpha channel customization. The indicator is designed to be clean, lightweight, and free from repainting. It supports various markets including Forex, indices, commodities, stocks, and cryptocurrencies.
Indicator profile

Customer reviews

4.3
Reviews: 6
5
33 %
4
67 %
3
0 %
2
0 %
1
0 %
Customer reviews
April 6, 2026
April 4, 2026
April 1, 2026
the best part is the process slows down in a good way, and a 1R exit plan makes review easier.
March 28, 2026
Helps more when the trader avoids forced trades. Account protection still comes first.
March 27, 2026
Solid enough as a backup opinion. It is just a support layer.
March 25, 2026
Fine for a side read, especially when the chart is not clean. It can add noise if overused.

Discussion

FAQ

BTCUSD
Forex
Signal
Indices
EURUSD
Commodities
GBPUSD
NZDUSD
Prop
Scalping
Crypto
Stocks
XAUUSD
NAS100
ATR
MACD
USDJPY
Products available through cTrader Store, including trading bots, indicators and plugins, are provided by third-party developers and made available for informational and technical access purposes only. cTrader Store is not a broker and does not provide investment advice, personal recommendations or any guarantee of future performance.

More from this author

Indicator
AI
Prop
+8
The EMA Trend Simple is a trend-following tool designed for simplicity and visual clarity.
cBot
Prop Firm Fit
Stop Loss (SL) Manager
+1
HTS Strategy Tester - Advanced Multi-Timeframe Trend & Pullback Trading System H1/m1 & H4/m5 WWS 33/144 Start from 100$
90.1%
ROI
2.92
Profit factor
Indicator
AI
Grid
+7
Follow The Trend cBot - INDICATOR - displays two Moving Average Bands for cBot or for your own use
Indicator
AI
SMC
+7
The ultimate tool for Price Action and ICT. High, Low and Mid levels for days, weeks Inc. NY Midnight and Custom Range.
Indicator
ATR
Prop
+13
HCCC MTF (Hurst Cycle Composite Channel), Designed for Semi-Automated Trading, Interactive MTF Dashboard
Indicator
AI
RSI
+7
EMA MTF TREND PRO - Multi-timeframe trend analysis overlay indicator, 6 timeframes - in one table with ADX
Indicator
Key Levels
TP_SL Very useful Risk & Reward Tool. Bring the ultimate TradingView-style Long/Short Position
Indicator
AI
SMC
+4
Weekly Daily Opening Gaps — NWOG & NDOG Indicator Professional-grade opening gap visualization for institutional traders
Indicator
AI
Prop
+7
EMA Clouds, Multi-Timeframe (MTF) Overlay, Swing High/Low detection, and a smart Dashboard with neutral zone filtering.
Indicator
ATR
Channel
+1
Bollinger Bands Advanced Squeeze & Breakout System, Real-Time On-Chart Dashboard, Auto-Squeeze Detector, Dual-Band Cloud
Indicator
AI
ATR
+12
The standard Relative Strength Index (RSI), RSI & Signal Cloud, Smart Volatility Filter (ATR), On-Chart Info Dashboard
Indicator
SMC
Prop
+11
Sessions PRO is a professional session visualization indicator - 4 Fully Customizable Sessions

You may also like

Indicator
Key Levels
Spots key hourly ranges and signals breakouts using arrows & colored background zones. Ideal for Gold.
Indicator
Customize your Moving Average! Choose any timeframe and price source for precision and flexibility in your analysis.
Indicator
ATR
Forex
+1
Trade fearlessly: auto-adjusts order blocks, manages risks, and ensures precision. Free for early users.
Indicator
Bollinger
Jurik Moving Average (Jurik's Moving Average) triple adaptive filter with unique Jurik smoothing and dynamic factor.
Indicator
ATR
RSI
+5
Gold Emperor: AI-driven XAUUSD dominance. Dynamic pivots, matrix trend logic, and institutional shield protection.
Indicator
ATR
BOS
+3
Fair Value Gaps with Multi-Timeframe.
Indicator
Forex
Crypto
+5
🚀 Automated Elliott Wave & Fibonacci tool for cTrader. Spot trends, corrections & retracements fast.
Indicator
ATR
RSI
+7
Identify bullish and bearish Order Blocks to spot key support/resistance levels and potential trend reversals! 📈🔄
Indicator
Fisher Transform with smoothing. Spot reversals and cycles with precision. Great for any market, any timeframe.
Indicator
SMC
VWAP
+16
It calculates Anchored VWAP and StdDev bands from a user-defined start date for cTrader charts.
Indicator
Key Levels
Liquidity Grab
+2
A practical XAUUSD workspace for mapped levels, session context, liquidity events, alerts and risk planning.
Indicator
AI
ATR
+12
The standard Relative Strength Index (RSI), RSI & Signal Cloud, Smart Volatility Filter (ATR), On-Chart Info Dashboard
Indicator
Flag
VWAP
+5
Session VWAP with statistical deviation bands, gradient cloud, and live rejection alerts — see exactly how stretched pri
Indicator
AI
ATR
+27
🔮 Smart Bar Predictor - Professional Volatility Forecasting Indicator
Indicator
Doji
Engulfing
+3
Multi Timeframe OHLC levels (daily, weekly, and monthly), with a two-day price action bias dashboard
Indicator
ATR
SMC
+18
Super Wick detects powerful candle rejections: fractal long-wicks, HTF resonance zones, and a WSI gauge.
Indicator
SMC
Prop
+15
Automatic Elliott Wave Detection with Professional Filters
Indicator
AI
ATR
+27
Market Cipher B

Price

29
Sales
808
Free installs