

Dynamic Bands VWAP
Indicator
1 purchases
Version 1.0, Jul 2026
Windows, Mac
Since 24/03/2026
13
Sales
111
Free installs
Description
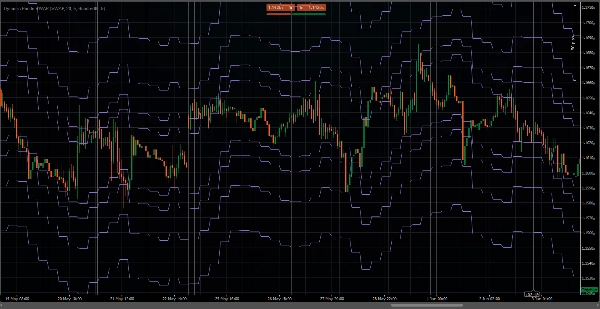
Don't trust static support and resistance levels, this indicator combine the widely used Fibonacci and VWAP in one setup that solves the shortcomings of each one. Now all levels are dynamic, based on Money Flow, Time Blocks and Mathematical Rules.
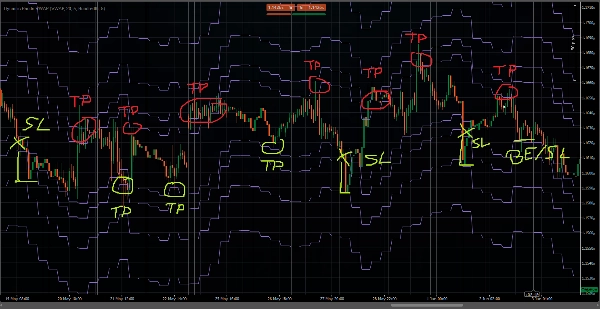
This indicator plots a stepped ladder of horizontal lines based on a moving VWAP/TWAP average. Instead of a smooth continuous line, it recalculates the average only every X bars (a “ladder step”), drawing flat horizontal segments that jump vertically to new levels at each step. The distances of the lines above and below the VWAP/TWAP follows a Fibonacci sequence multiplied by a user‑selected percentage scale (Fibonacci Scale).
Parameters
- Average Type – VWAP (volume‑weighted) or TWAP (time‑weighted).
- Period (bars) – Lookback window for the average calculation.
- Number of lines above/below – How many Fibonacci‑spaced levels to draw on each side (≥2).
- Fibonacci Scale – Base percentage unit for the spacing.
- Update every X bars – Frequency of ladder recalculation; the average and all lines remain constant between updates.
How to use? Can be used as:
- All Mean-Reversion Strategies
- Support and Resistance validation
- Best price to enter and get out
- Overbrought/Overselled oscillator
- MTF Confluence
- Full replacement to Bollinger Bands
- And more.
Summary
AI summary
Dynamic Bands VWAP is a technical indicator that integrates Fibonacci levels with VWAP (Volume Weighted Average Price) or TWAP (Time Weighted Average Price) to provide dynamic support and resistance levels. Unlike static levels, this indicator recalculates averages and plots horizontal lines in a stepped ladder format every set number of bars, creating flat segments that adjust vertically at each update. The spacing of these lines above and below the average follows a Fibonacci sequence scaled by a user-defined percentage.
Key parameters include the choice between VWAP or TWAP averages, the lookback period for calculations, the number of Fibonacci-spaced lines displayed above and below the average, the Fibonacci scale for spacing, and the frequency of updates (every X bars). The indicator bases its dynamic levels on money flow, time blocks, and mathematical rules.
It can be applied in various trading contexts such as mean-reversion strategies, support and resistance validation, identifying optimal entry and exit prices, overbought/oversold oscillation, multi-timeframe confluence, and as a full alternative to Bollinger Bands. The indicator supports volume and bar data inputs and provides visualizations, signals for breakouts, reversals, volatility regimes, and level touches or breaks.
Key parameters include the choice between VWAP or TWAP averages, the lookback period for calculations, the number of Fibonacci-spaced lines displayed above and below the average, the Fibonacci scale for spacing, and the frequency of updates (every X bars). The indicator bases its dynamic levels on money flow, time blocks, and mathematical rules.
It can be applied in various trading contexts such as mean-reversion strategies, support and resistance validation, identifying optimal entry and exit prices, overbought/oversold oscillation, multi-timeframe confluence, and as a full alternative to Bollinger Bands. The indicator supports volume and bar data inputs and provides visualizations, signals for breakouts, reversals, volatility regimes, and level touches or breaks.
Indicator profile
Indicator category
Support & resistance
Output type
Visualisation
Signals
Filter
Data requirements
Bars only
Volume
Supported signals
Breakout
Reversal
Volatility
Level touch
Level break
Customer reviews
0.0
Reviews: 0
Customer reviews
No reviews for this product yet. Already tried it? Be the first to tell others!
Discussion
FAQ
Fibonacci
Key Levels
Volume
VWAP
Support & Resistance
Products available through cTrader Store, including trading bots, indicators and plugins, are provided by third-party developers and made available for informational and technical access purposes only. cTrader Store is not a broker and does not provide investment advice, personal recommendations or any guarantee of future performance.





















Price
Since 24/03/2026
13
Sales
111
Free installs