
Description
Classic Proportional CVD (Anchored)
Unlock the true intent of market participants with the Classic Proportional CVD. Unlike standard Cumulative Volume Delta indicators that simply add up tick volume, this tool uses a Proportional Logic to weigh volume based on actual price action within every bar.
Why "Proportional" Delta?
Standard CVD can be misleading. This indicator calculates the delta by analyzing the relationship between the Bar Range (High-Low) and the Close-Open distance. This ensures that volume is distributed realistically:
- Strong conviction candles (closing near the high/low) contribute more to the delta.
- Wick-heavy candles (signs of absorption or rejection) neutralize the delta, preventing "fake" volume signals.
Key Features
- ⚓ Smart Anchoring (Multi-Timeframe Reset): Keep your analysis relevant to the current trading session. Choose to reset the calculation Daily, Weekly, or Monthly—or keep it running indefinitely.
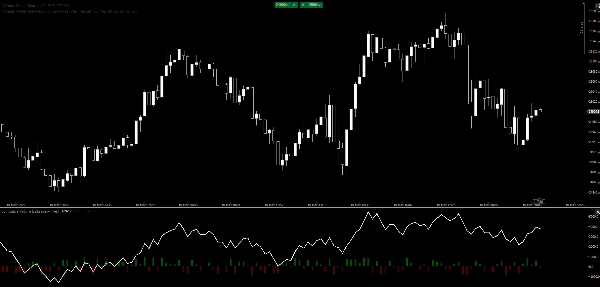
- 📊 Dual-Visuals:
- The CVD Line: A clean, high-performance line for spotting long-term divergences and trend exhaustion.
- Histogram Overlay: Instant visual feedback on per-bar buying/selling pressure to identify climax or absorption at a glance.
- ⚡ Ultra-Lightweight: Written with native C# optimization for cTrader, ensuring zero lag even on lower-end machines or volatile markets.
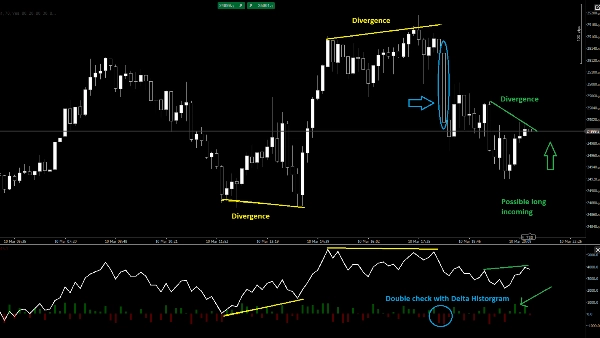
- 🎯 Divergence Spotting: Easily identify when the price is making new highs while the CVD is failing—a classic sign of institutional distribution.
How to Trade with it
- Trend Confirmation: Look for the CVD line to trend in the same direction as the price.
- Absorption: When price hits a new low but the CVD Histogram shows strong "Delta Up" (Green), buyers are absorbing the selling pressure.
- Exhaustion: Watch for a sharp spike in the histogram (Climax) followed by a CVD line reversal.
Parameters:
- Anchor Mode: Never, Daily, Weekly, Monthly.
- Show Bar Delta: Toggle the histogram on/off.
Unlock the true intent of market participants with the Classic Proportional CVD. Unlike standard Cumulative Volume Delta indicators that simply add up tick volume, this tool uses a Proportional Logic to weigh volume based on actual price action within every bar.
Why "Proportional" Delta?
Standard CVD can be misleading. This indicator calculates the delta by analyzing the relationship between the Bar Range (High-Low) and the Close-Open distance. This ensures that volume is distributed realistically:
- Strong conviction candles (closing near the high/low) contribute more to the delta.
- Wick-heavy candles (signs of absorption or rejection) neutralize the delta, preventing "fake" volume signals.
Key Features
- ⚓ Smart Anchoring (Multi-Timeframe Reset): Keep your analysis relevant to the current trading session. Choose to reset the calculation Daily, Weekly, or Monthly—or keep it running indefinitely.
- 📊 Dual-Visuals:
- The CVD Line: A clean, high-performance line for spotting long-term divergences and trend exhaustion.
- Histogram Overlay: Instant visual feedback on per-bar buying/selling pressure to identify climax or absorption at a glance.
- ⚡ Ultra-Lightweight: Written with native C# optimization for cTrader, ensuring zero lag even on lower-end machines or volatile markets.
- 🎯 Divergence Spotting: Easily identify when the price is making new highs while the CVD is failing—a classic sign of institutional distribution.
How to Trade with it
- Trend Confirmation: Look for the CVD line to trend in the same direction as the price.
- Absorption: When price hits a new low but the CVD Histogram shows strong "Delta Up" (Green), buyers are absorbing the selling pressure.
- Exhaustion: Watch for a sharp spike in the histogram (Climax) followed by a CVD line reversal.
Parameters:
- Anchor Mode: Never, Daily, Weekly, Monthly.
- Show Bar Delta: Toggle the histogram on/off.
Summary
Key features include smart anchoring with multi-timeframe resets (daily, weekly, monthly, or continuous), dual visuals comprising a CVD line for spotting divergences and trend exhaustion, and a histogram overlay for immediate per-bar buying or selling pressure insights. The indicator is optimized in native C# for cTrader, ensuring high performance and low resource use.
Traders can use the indicator for trend confirmation by aligning CVD direction with price, identify absorption when price lows coincide with strong positive delta in the histogram, and detect exhaustion through histogram spikes followed by CVD reversals. Adjustable parameters include anchor mode and histogram display toggle.
This tool supports analysis across multiple markets and symbols, including Forex, cryptocurrencies, indices, commodities, and stocks.
Customer reviews
5 | 0 % | |
4 | 100 % | |
3 | 0 % | |
2 | 0 % | |
1 | 0 % |


