present
Sign up and get $50 off your first purchase
Trading product for Volume Profile HD Indicator Breakout Scalping, image 1
Volume Profile HD
Indicator
Version 1.1, Apr 2026
Windows, Mac
4.0
Reviews: 3
Trading product for Volume Profile HD Indicator Breakout Scalping, image 2
Trading product for Volume Profile HD Indicator Breakout Scalping, image 3
Trading product for Volume Profile HD Indicator Breakout Scalping, image 4
Trading product for Volume Profile HD Indicator Breakout Scalping, image 5
Since 09/05/2025
6
Sales

Description

Full Product Description

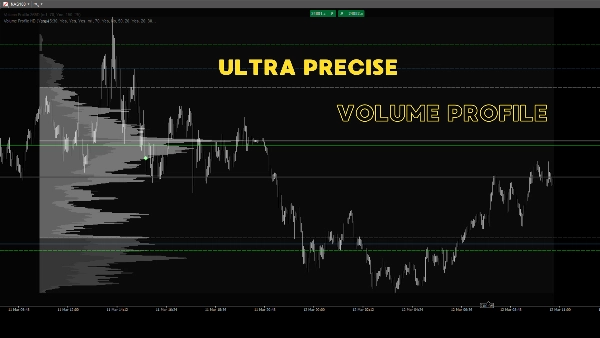
Elevate your trading with the Rolling Volume Profile MTF, a professional-grade indicator designed specifically for cTrader. This tool provides deep insights into market structure by displaying dynamic, rolling volume profiles directly on your chart.

Instead of relying on fixed daily profiles, this indicator continuously calculates the volume distribution over the last 24 Hours, 7 Days, and 30 Days. This gives you a massive edge in identifying true intraday and swing support/resistance levels based on actual traded volume, not just price action.

πŸ”₯ Key Features:

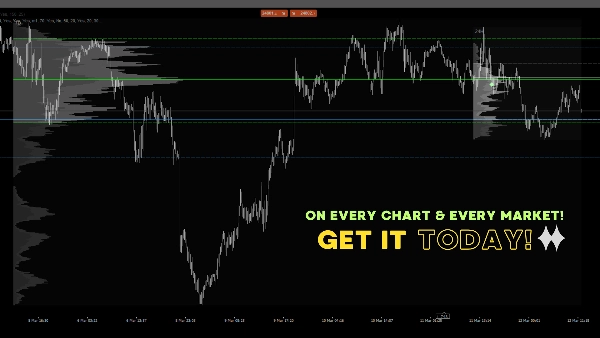
  • 3 Rolling Profiles: Simultaneously view 24H, 7D, and 30D volume distributions in one clean view.
  • Core Volume Levels: Automatically calculates and plots the Point of Control (POC), Value Area High (VAH), and Value Area Low (VAL) for each profile.
  • Extended Value Lines: Option to project POC, VAH, and VAL lines forward into the future to anticipate upcoming reactions.
  • Precise NY Open Marker: Automatically plots a distinct marker (diamond) at the exact New York Session open price. Perfect for Initial Balance and session-based strategies.
  • Multi-Timeframe Precision: Uses granular lower-timeframe data (e.g., 1-minute bars) to build highly accurate profiles on any higher timeframe chart.
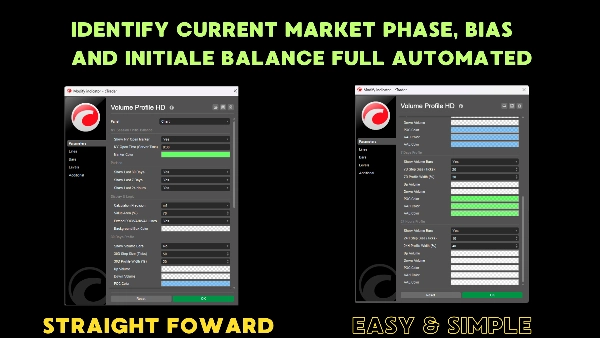
  • Fully Customizable: Adjust tick step sizes, profile widths, Value Area percentages (default 70%), and customize colors for bullish/bearish volume and background boxes.

πŸ’‘ Why use this indicator?
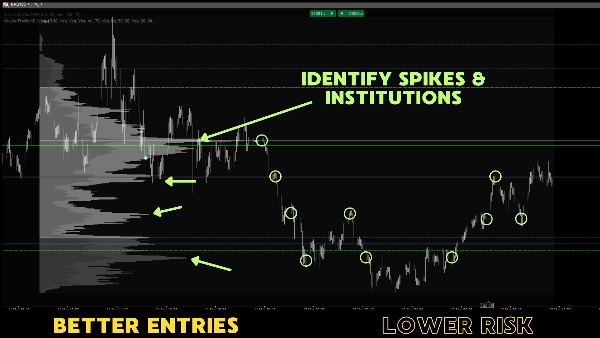
Institutional traders rely on volume and value areas to find fair prices and liquidity pools. By visualizing where the most volume was traded over specific rolling periods, you can easily spot high-probability breakout, bounce, and reversal zones. The integrated NY Open marker ensures you never lose sight of the most crucial intraday reference price.

Perfect for Day Traders, Scalpers, Futures/Forex Traders, and anyone looking for an institutional edge in their chart analysis.

Summary

AI summary
Volume Profile HD is a multi-timeframe rolling volume profile indicator designed for the cTrader platform. It continuously calculates and displays dynamic volume distributions over the last 24 hours, 7 days, and 30 days, providing traders with detailed insights into market structure based on actual traded volume. The indicator automatically plots key volume levels including the Point of Control (POC), Value Area High (VAH), and Value Area Low (VAL) for each profile, with an option to extend these levels forward to anticipate future price reactions.

A precise New York Session open price marker is included, aiding session-based and initial balance strategies. The indicator builds highly accurate profiles by utilizing granular lower-timeframe data, such as 1-minute bars, on any higher timeframe chart. Customization options allow adjustment of tick step sizes, profile widths, value area percentages, and color schemes for bullish and bearish volumes and background boxes.

This tool is suitable for day traders, scalpers, futures, and forex traders seeking to identify institutional volume levels, support and resistance zones, and high-probability breakout or reversal areas. Supported markets include indices and symbols like NAS100 and XAUUSD.
Indicator profile

Customer reviews

4.0
Reviews: 3
5
0 %
4
100 %
3
0 %
2
0 %
1
0 %
Customer reviews
March 23, 2026
fits a trader who wants less noise in the process. The best use is checking participation and pressure, then leaving the final filter manual.
March 21, 2026
Tbh the value is mostly in filtering bad ideas. I still would not trust it live without checking the chart myself. A cautious first pass gives a cleaner opinion.
March 14, 2026
For volume based context, the practical question is whether it reduces bad decisions. A 62 setup journal on New York open makes that clearer.

Discussion

FAQ

Breakout
Scalping
Indices
Fair Value Gap
SMC
XAUUSD
NAS100
Products available through cTrader Store, including trading bots, indicators and plugins, are provided by third-party developers and made available for informational and technical access purposes only. cTrader Store is not a broker and does not provide investment advice, personal recommendations or any guarantee of future performance.

More from this author

Indicator
SMC
Prop
+17
Unlock the true intent of market participants with the Classic Proportional Cumulative Volume Delta CVD!
Indicator
SMC
NAS100
+5
Detects extreme trading volume using dynamic percentiles and plots bullish/bearish clusters directly on your chart.

You may also like

Indicator
SMC
Prop
+14
FVG Multi Time Frame Indicator
Indicator
Forex
Crypto
+2
PREMIUN INDICATOR
Indicator
AI
ATR
+19
QX SessionBox ORB: Session boxes + ORB levels + clean dashboard with optional closed-candle breakout signals.
Indicator
The Multi-Timeframe Candle Indicator displays candles from multiple timeframes in one window, enhancing market analysis!
Indicator
Forex
EURUSD
+4
Check the correlations between dozens of assets in one elegant display.
Indicator
BOS
CHOCH
+5
A professional-grade cTrader indicator for traders following the Inner Circle Trader (ICT) methodology.
Indicator
ADX
ATR
+5
Identifies TRENDING, RANGING and VOLATILE markets with pullback detection. Anti-noise filter. Works on ANY chart.
Indicator
ATR
RSI
+19
Multi-timeframe heatmap scoring Direction, Strength & Volatility at a glance!
Indicator
This indicator is a valuable tool for traders looking to identify significant opening price level of any asset.
Indicator
ATR
Channel
Reversal Trap Probability Bands plots a dynamic volatility envelope around price & automatically detects "trap" reversal
Indicator
Forex
BTCUSD
+7
πŸš€ TMAX RBA Indicator - The Ultimate Multi-Timeframe Momentum System πŸš€
Indicator
BOS
CHOCH
+5
MyZTrade High TF candle is a multi-timeframe visualisation tool that overlays completed higher-timeframe candles.
Indicator
BOS
Volume
+5
20/40/60-day IPDA lookback ranges, Premium/Discount/Equilibrium zones, and quarterly shift alerts β€” anchored to true dai
Indicator
BOS
CHOCH
+3
Identifies HH, HL, LH, and LL swing points using fractals. Essential for Smart Money Concepts and price action.
Indicator
Prop
Forex
+4
Automatic Support/Resistance zones from swing points.
Indicator
AI
ATR
+27
An advanced VWAP with multi-VWAP (Daily/Weekly/Monthly/Anchored), click-to-anchor, configurable alerts, a stats panel,
Indicator
Customizable window inside your platform, access to any website Calendar
Indicator
RSI
Signal
+2
Dynamic circles visualize price's volatility position. Like RSI for market overextension & stretch. Quantify context.

Price

Since 09/05/2025
6
Sales