
Descrição
SmartFibonacci — Retrações e extensões de Fibonacci automáticas e configuráveis com suporte a prazos maiores, etiquetas de preço e alertas de proximidade para decisões de negociação mais rápidas e confiantes.
Descrição curta pronta para loja (1–2 linhas)
SmartFibonacci detecta automaticamente os pontos altos/baixos do swing e desenha retrações claras de Fibonacci e extensões opcionais no seu gráfico. Retrospectiva configurável, detecção de swing em prazos maiores, preços/percentuais rotulados e alertas de proximidade tornam-no ideal tanto para scalping intradiário quanto para setups de swing.
Descrição completa do produto (pronta para copiar e colar na cTrader Store)
SmartFibonacci é um indicador leve e focado em desempenho para cTrader que automatiza a análise de Fibonacci para que você possa gastar menos tempo desenhando níveis e mais tempo negociando. Ele localiza o swing alto e baixo mais recentes dentro de uma retrospectiva configurável, desenha níveis de retração e níveis opcionais de projeção (extensão), e exibe etiquetas de preço e percentual para rápida interpretação. Para sinais robustos, o SmartFibonacci pode calcular pontos de swing em um prazo maior enquanto renderiza os níveis no seu gráfico atual. Alertas integrados (popup + som) notificam quando o preço se aproxima dentro de uma distância configurável em pips de qualquer nível visível de Fibonacci.
Esta listagem inclui: capturas de tela claras mostrando elementos-chave da interface, fluxos de trabalho exemplares, configurações de configuração e saídas de exemplo (etiquetas de preço, extensões, alertas) para facilitar a avaliação da funcionalidade e UX pelos compradores antes da compra.
Principais características
- Detecção automática de swing — encontra o swing alto/baixo mais recente dentro de uma janela de retrospectiva configurável.
- Opção de swing em prazo maior — calcula pivôs de swing em um prazo maior para níveis mais suaves e significativos.
- Retrações & Extensões — desenha linhas padrão de retração e níveis opcionais de projeção (extensão) (percentuais definidos pelo usuário como 127.2, 161.8, etc.).
- Etiquetas de preço & percentual — cada nível visível mostra seu percentual e o preço exato para tomada rápida de decisão.
- Visuais personalizáveis — defina cores (retração / extensão), espessura da linha e estilo da linha.
- Alertas de proximidade — popup + som quando o preço entra em um raio configurável de pips de um nível visível de Fibonacci; opção para alertar apenas o nível mais próximo.
- Lógica eficiente de redesenho — o indicador redesenha apenas quando os pivôs de swing mudam para reduzir a desordem no gráfico e o uso da CPU.
- Padrões seguros — padrões sensatos para traders que querem uso imediato após a instalação.
- Compatível com cTrader / cAlgo — projetado para funcionar como um indicador sobreposto.
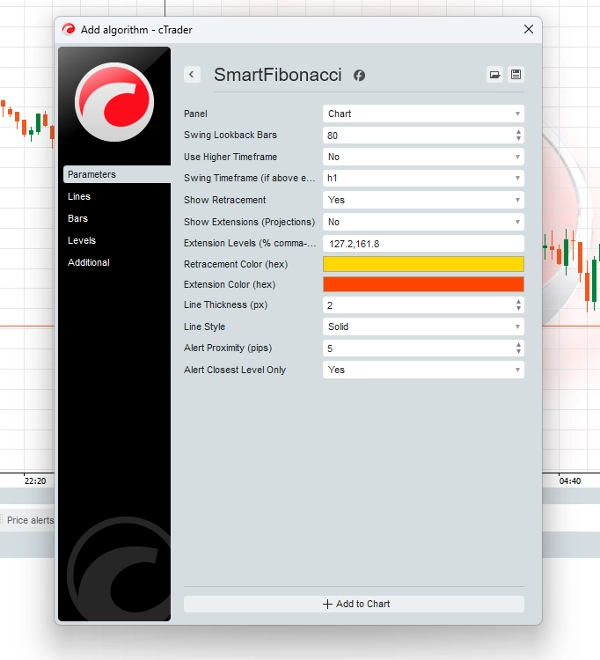
Configuração (parâmetros & explicações)
- Barras de Retrospectiva do Swing (int) — quantas barras buscar para encontrar o swing alto/baixo (padrão 80).
- Usar Prazo Maior (bool) — habilita a detecção em um prazo maior enquanto desenha no gráfico atual.
- Prazo do Swing (TimeFrame) — o prazo maior a ser usado quando
Use Higher Timeframeestá habilitado. - Mostrar Retração (bool) — alterna o desenho dos níveis de retração.
- Mostrar Extensões (bool) — alterna o desenho dos níveis de extensão/projeção.
- Níveis de Extensão (string) — valores percentuais separados por vírgula (ex.,
127.2,161.8) usados para popular as linhas de projeção. - Cor da Retração / Cor da Extensão (hex) — escolha cores para as linhas de retração e extensão.
- Espessura da Linha (px) — configuração inteira da espessura da linha.
- Estilo da Linha (enum) — escolha sólido, tracejado etc.
- Proximidade do Alerta (pips) — distância em pips para alertas de proximidade.
- Alertar Apenas o Nível Mais Próximo (bool) — quando habilitado, apenas o nível fib mais próximo dispara o popup.
Saídas analíticas & elementos UX
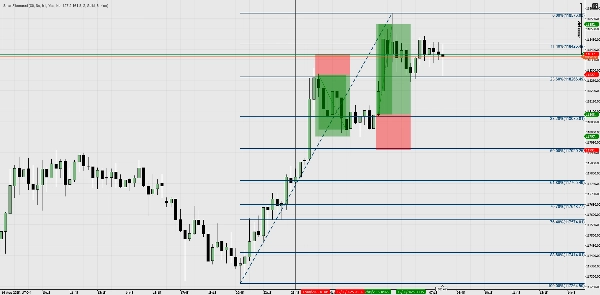
- Linhas no gráfico — linhas de retração e extensão com etiquetas claras de percentual (ex., 61.8%) e etiquetas de preço (ex., 1.23456).
- Notificações popup — o usuário recebe um popup na tela e o som do sistema quando o preço entra na área de
Alert Proximity. - Redesenhos não intrusivos — atualiza apenas quando o swing detectado muda para evitar flicker frequente no redesenho.
- Consistência da fonte de preço — alertas e etiquetas são calculados usando a mesma série de Barras em que o fib foi desenhado (importante ao usar cálculo em prazo maior).
Fluxos de trabalho exemplares / cenários de uso
- Configuração rápida (scalping / intradiário)
-
- Anexe o SmartFibonacci a um gráfico de 5 minutos, defina
Lookback = 80,ShowRetrace = true. - Observe os níveis de retração e use 61.8% / 50% como zonas de reação intradiárias.
- Habilite
Alert Proximity = 5 pipspara ser notificado quando o preço se aproximar de níveis importantes.
- Anexe o SmartFibonacci a um gráfico de 5 minutos, defina
- Contexto de prazo maior (swing trading)
-
- Defina
Use Higher Timeframe = truee selecioneHigher Timeframe = H4(ou Diário). - Os níveis refletem swings H4 enquanto você negocia em H1 ou M30 — melhor alinhamento com a estrutura do prazo maior.
- Use extensões (127.2, 161.8) como metas de lucro para trades swing.
- Defina
- Validação + confluência
-
- Combine os níveis do SmartFibonacci com seu suporte/resistência existente, quebras de estrutura ou médias móveis para validar entradas.
- Use os alertas popup para cronometrar entradas ou registre as interações para backtesting.
- Fluxos de trabalho orientados por alertas
-
- Mantenha o indicador ligado enquanto monitora múltiplos gráficos; receba popups quando o preço se aproximar de qualquer nível fib visível configurado e aja conforme necessário.
Resumo
Avaliações de clientes
5 | 100 % | |
4 | 0 % | |
3 | 0 % | |
2 | 0 % | |
1 | 0 % |


