
Descrição
ZigzagSR – Oscilações Zigzag Dinâmicas com Suporte e Resistência Automatizados
Desbloqueie uma estrutura de mercado mais clara e zonas de entrada precisas com o ZigzagSR, um poderoso indicador cTrader que:
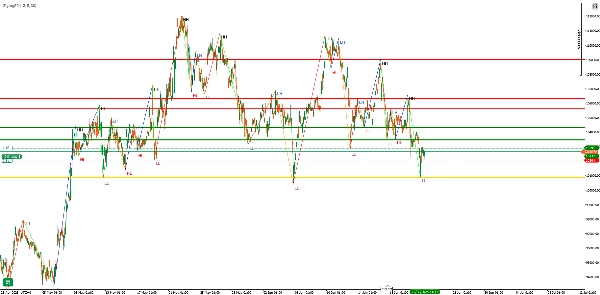
- Plota oscilações zigzag que não repintam (máximas mais altas, máximas mais baixas, mínimas mais altas, mínimas mais baixas) em tempo real
- Desenha automaticamente níveis dinâmicos de suporte e resistência baseados nas oscilações pivô mais recentes
- Rotula cada ponto de oscilação (“HH”, “LH”, “HL”, “LL”) para clareza imediata da tendência
Principais Características
- Detecção Adaptativa de Zigzag
-
- Parâmetros configuráveis Depth, Deviation e Backstep para ajustar a sensibilidade ao ruído do mercado
- Lógica que não repinta garante que os sinais históricos permaneçam estáveis após serem desenhados
- Níveis Automáticos de SR
-
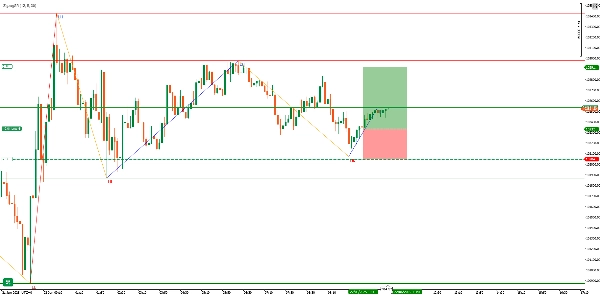
- Desenha uma linha Pivot no último ponto de oscilação válido (linha dourada)
- Destaca até as últimas três máximas de Resistance (linhas vermelhas) e três mínimas de Support (linhas verdes) antes do pivô
- As linhas atualizam-se suavemente conforme novas oscilações se formam, mantendo seu gráfico organizado
- Rótulos Visuais Claros
-
- “HH” (Higher High) e “LH” (Lower High) para picos baixistas/mais altos
- “HL” (Higher Low) e “LL” (Lower Low) para vales altistas/mais baixos
- Segmentos zigzag codificados por cor:
-
- HH → Verde-limão
- LH → Laranja
- HL → Azul
- LL → Vermelho
Entradas e Personalização
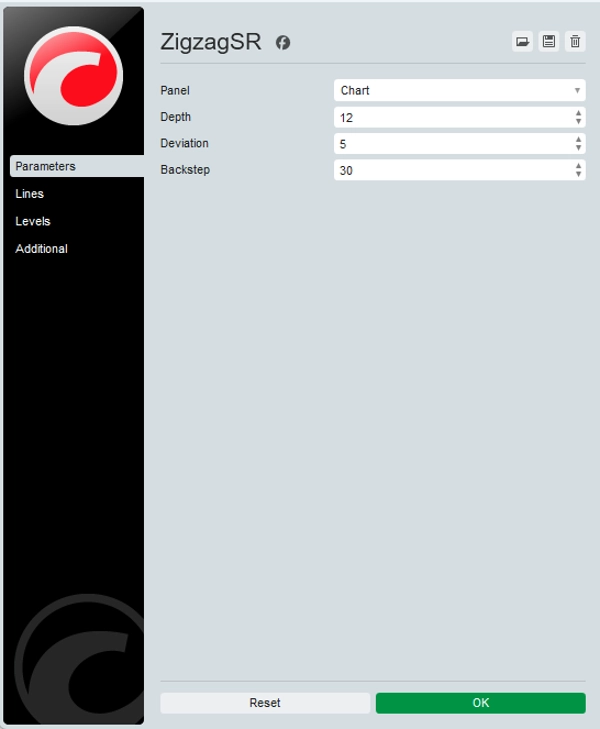
ParâmetroPadrãoDescrição
Depth
12
Barras de retrocesso para identificar máximas/mínimas locais
Deviation
5
Movimento mínimo de preço (em ticks) para contar como uma oscilação
Backstep
3
Barras para “retroceder” para suprimir pivôs falsos
Dica: Aumente Depth e Deviation em timeframes maiores para filtrar ruído; diminua-os em M1/M5 para maior sensibilidade.
Por Que Usar o ZigzagSR?
- Confirmação de Tendência: Distinga claramente oscilações impulsivas de movimentos corretivos—ideal para traders de swing e breakout.
- Zonas de Entrada SR: Níveis marcados automaticamente ajudam a identificar zonas de entrada, stop-loss e take-profit sem desenhar linhas manualmente.
- Desenvolvimento de Estratégia: Rótulos e linhas alimentam diretamente EAs/cBots ou sistemas manuais—construa setups consistentes e baseados em regras.
Como Funciona
- Mapeamento de Máximas/Mínimas
-
- Escaneia barras nos últimos
Depthperíodos para identificar extremos locais (_highMape_lowMap).
- Escaneia barras nos últimos
- Construção da Oscilação
-
- Alterna entre estados altistas e baixistas, adicionando apenas pivôs significativos à lista de oscilações.
- Atribuição de Rótulos
-
- Compara cada pivô com o anterior para rotulá-lo como HH/LH ou HL/LL.
- Desenho de SR
-
- Identifica o pivô mais recente como “linha pivô”, depois plota as três máximas e mínimas válidas anteriores como resistência/suporte.
- Renderização do Zigzag
-
- Conecta todos os pontos de oscilação com linhas de tendência coloridas e sobrepõe rótulos de texto ligeiramente deslocados para clareza.
Casos de Uso e Dicas
- Swing Trading: Aproveite impulsos de múltiplas barras—entre em retrações para a linha pivô, mire no próximo nível SR.
- Confirmação de Breakout: Espere o preço romper uma linha de resistência desenhada pelo ZigzagSR, depois confirme com volume ou RSI.
- Sobreposição com Outros Indicadores: Combine com médias móveis, divergências de RSI ou perfis de volume para fortalecer os sinais.
Comece em segundos:
- Instale o ZigzagSR na cTrader Store.
- Adicione-o a qualquer gráfico—não são necessárias bibliotecas externas.
- Ajuste os três parâmetros de entrada para seu timeframe e estilo de estratégia preferidos.
Eleve sua análise gráfica com estrutura de oscilação em tempo real e suporte e resistência dinâmicos—experimente ZigzagSR hoje!
Resumo
Avaliações de clientes
5 | 33 % | |
4 | 67 % | |
3 | 0 % | |
2 | 0 % | |
1 | 0 % |


