
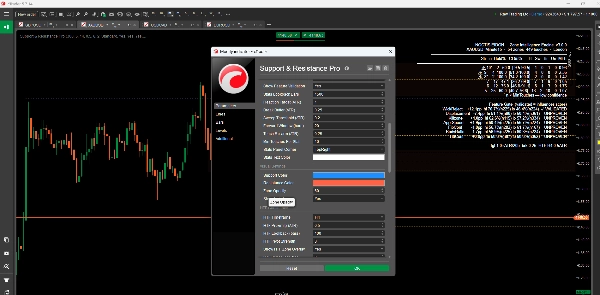
Support & Resistance Pro
インジケーター
53 購入済
バージョン 3.0、Jul 2026
Windows、Mac
5.0
レビュー: 1
説明
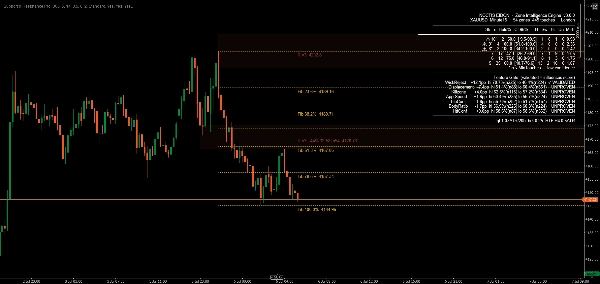
Support & Resistance Proはサポートおよびレジスタンスゾーンを特定し、ほとんどのS/Rツールとは異なり、仮定ではなく実際の過去のデータに基づく独立した統計エンジンを使用してそれらのゾーンが実際に機能するかどうかを測定します。すべてのゾーンは、後に破られてチャートから消えたゾーンも含む完全な過去のゾーン集団から計算された信頼区間付きの保持率統計を表示します。このカテゴリのほとんどのインジケーターは、今日まだ見えるレベルのみをカウントしており、これがすべての強さの主張を静かに膨らませていますが、これはそうではありません。
主な特徴
- 統計的に検証されたゾーン すべてのゾーンは95%の信頼区間付きの実際に測定された保持率を持ち、仮定された強度スコアではありません。接触点でのヒゲ拒否という1つのシグナルは正式に検証されており、EURUSDおよびビットコインで複数の時間枠にわたり確認され、未見のデータで効果が持続した真のアウトオブサンプルテストも含まれます。
- 自動的な役割の反転 破られたサポートは自動的にレジスタンスになり、その逆も同様で、明確な視覚マーカーがあります。インジケーターはゾーンが価格のどちら側にあるかを追跡し、それに応じて色を付け、ゾーンが元々形成された方法に色を固定しません。
- 上位時間枠との合流 チャート上のゾーンは選択した上位時間枠と照合され、マッチするHTF構造が別の視覚的オーバーレイとして直接チャートに描画されます。
- フィボナッチリトレースメント統合 最新のスイングからの自動フィボナッチリトレースメントレベルが、それぞれ比率とブローカーのネイティブ精度での正確な価格でラベル付けされ、近隣のゾーンと自動的に整理されてラベルが重ならないようになっています。
- 飽和警告 あまりにも多くテストされたゾーンは強いと仮定されるのではなくフラグが立てられます。データは、頻繁にテストされたゾーンはおそらくその休止中の流動性が既に使い果たされているため、パフォーマンスが悪い傾向があることを示しています。
- オープンバリデーションゲート ボディ比率、接近速度、セッション/キルゾーンのタイミング、変位テストなど6つの追加候補シグナルが組み込みの統計パネルでライブ表示され、それぞれ独自の保持率読み出しがあります。これらは、各々がヒゲ拒否と同じ証拠基準を独立してクリアするまではスコアやランキングに影響を与えません。何が証明されていて何がそうでないかを正確に見ることができます。
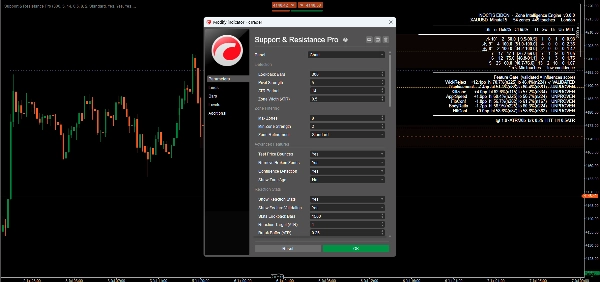
- カスタマイズ可能な設定 検出感度、ゾーンフィルタリング、視覚スタイル、アラート動作にわたる広範なパラメーター制御。
- リアルタイムアラート ゾーン接触、ブレイクアウト、合流イベントに対する設定可能なポップアップ、メール、サウンドアラートで、チャネルごとに独立して切り替え可能。
利点
- 仮定ではなく証拠: チャート上のすべての統計は独立して検証可能であり、インジケーターには独自のインサンプル/アウトオブサンプル検証ツールが含まれています
- サバイバーシップバイアスなし: 強度の主張は、たまたま生き残ったレベルだけでなく、完全な過去のゾーン集団に基づいています
- 正直な開示: 証明済みおよび未証明のシグナルは常にチャート上でそのようにラベル付けされています
対象
レベルの背後にある統計的証拠を見たいトレーダー、単なるラインではなく—デイトレーダー、スイングトレーダー、そしてフォレックス、暗号通貨、その他の金融商品で厳密に測定されたサポートとレジスタンスのアプローチを求めるシステマティックトレーダー。
結論
Support & Resistance Proは一つの原則に基づいて構築されています:強度の主張は測定されるまで本物ではない。1つのシグナルは、複数の銘柄、複数の時間枠、アウトオブサンプルの確認を経てその基準をクリアしました。残りはまだテスト中として正直に表示されています—検証できない数値は表示する価値がないからです。
概要
AIによる概要
Support & Resistance Pro is an advanced trading indicator designed to identify critical support and resistance levels in financial markets. It uses advanced algorithms and historical price data to enhance technical analysis and support informed trading decisions. Key features include:
- Dynamic support and resistance levels that adjust in real-time based on recent price action.
- Multi-timeframe analysis to view levels across different timeframes for a comprehensive market overview.
- Calculation and display of pivot points to mark potential intraday reversal zones and target prices.
- Highlighting of psychological price levels (round numbers) to gauge market sentiment.
- Integration of Fibonacci retracement levels to assist in identifying support and resistance during price corrections.
- Customizable settings for lookback periods, visualization styles, and color schemes to suit individual trading preferences.
- Clear graphical representation for easy identification of market conditions.
- Configurable real-time alerts when prices approach critical levels.
This indicator supports various trading styles including scalping, day trading, and swing trading, and is suitable for traders in forex, commodities, stocks, and indices markets. It is intended for both beginner and experienced traders seeking structured market analysis and enhanced decision-making through reliable support and resistance data.
インジケーターのプロフィール
インジケーターのカテゴリー
サポート&レジスタンス
出力の種類
ビジュアル表示
シグナル
データ要件
バーのみ
サポート対象のシグナル
ブレイクアウト
反転
ラインタッチ
ラインブレイク
カスタマーレビュー
5.0
レビュー: 1
5 | 100 % | |
4 | 0 % | |
3 | 0 % | |
2 | 0 % | |
1 | 0 % |
カスタマーレビュー
November 8, 2025
A clean, reliable S/R mapper ⚡. Support & Resistance Pro marks key zones with clarity and speed - perfect for Price Action fans who need structure, not clutter. No alerts or price labels yet, but for spotting reaction levels and planning entries, it’s a solid chart companion.
ディスカッション
よくあるご質問
Fibonacci
Forex
Breakout
Scalping
GBPUSD
cTrader Storeで入手可能な取引ボット、インジケーター、プラグインなどの商品は、第三者の開発者が提供するものであり、情報と技術の取得のみを目的としてご利用いただけます。cTrader Storeはブローカーではなく、投資助言や個人的な推奨を行うことも、将来のパフォーマンスを保証することもありません。


![「[Stellar Strategies] Inside Bar with Signals」ロゴ](https://cdn.ctrader.com/image/webp/1d9e8bfa-3b2c-4440-bb37-5856902008a7_30683)


価格
登録日 22/11/2024
133
販売
2.57K
無料インストール