
NewsGuard High-Impact News Risk Overlay
インジケーター
2 購入済
バージョン 1.0、Jan 2026
Windows、Mac
5.0
レビュー: 1
説明
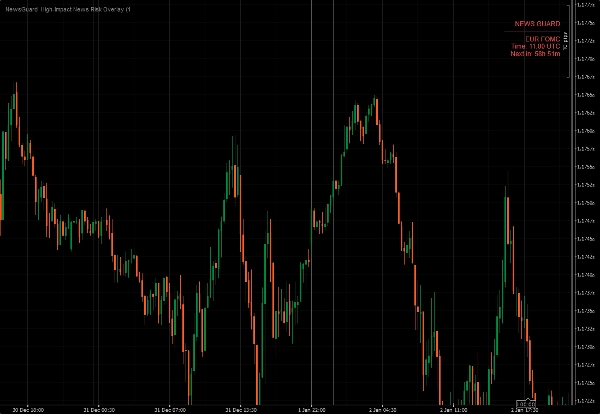
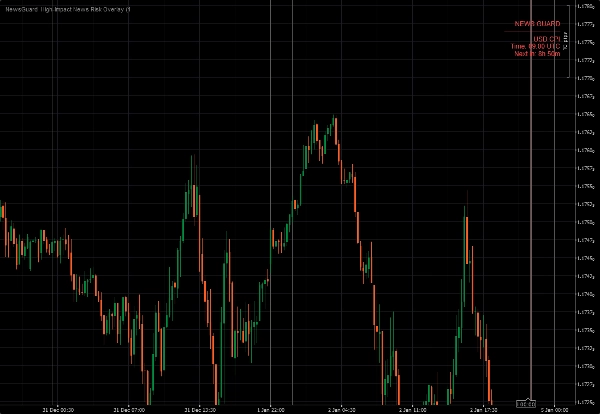
NewsGuard – 高インパクトニュースリスクオーバーレイ は、cTrader向けのプロフェッショナルなリスク認識ツールです。
主要な経済イベントの周辺の時間帯を視覚的に強調表示し、極端なボラティリティ、スプレッド拡大、およびスリッページを引き起こすことが知られています。
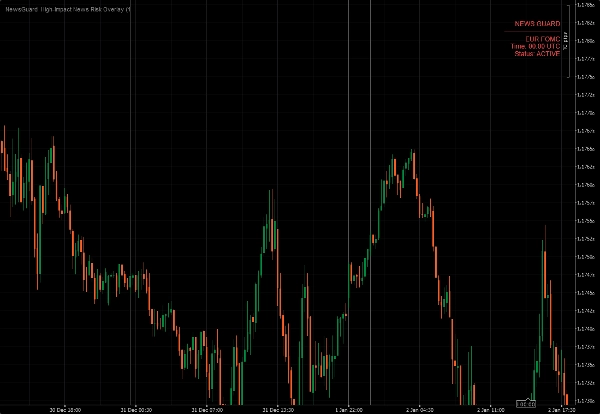
動きが起こった後に反応するのではなく、NewsGuardは リスクが高まる前に 警告します。
NewsGuardが示すもの
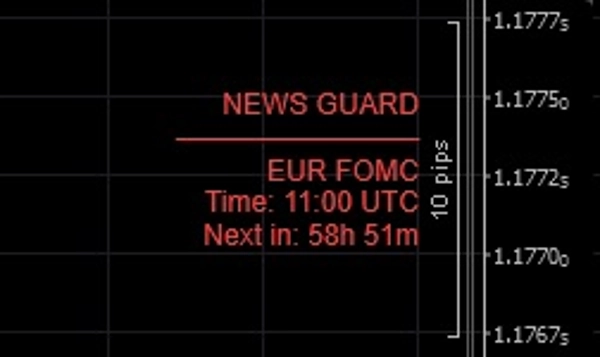
- チャート上に直接表示される高インパクトニュースリスクゾーン
- 各イベントの前後に調整可能な時間ウィンドウ
- 今後または現在のニュース情報を含むクリーンなオーバーレイ
- 取引されているシンボルに基づく自動関連性フィルタリング
NewsGuardは 手動の高インパクトスケジュール を使用しており、以下の特徴があります:
- 信頼性が高い
- ストアに安全に保存可能
- 外部フィードやAPIに依存しない
NewsGuardが提供しないもの
- ニュースフィードはありません
- 予測はありません
- 取引シグナルはありません
NewsGuardの目的はただ一つです:
時間に基づくリスクを認識させること。
スキャルパー、デイトレーダー、そして主要なニュースイベントに盲目的に取引を行いたくないすべての人に最適です。
概要
AIによる概要
NewsGuard High-Impact News Risk Overlay is a risk-awareness indicator designed for the cTrader platform. It visually marks time windows around major economic events known to cause significant market volatility, spread widening, and slippage. The overlay displays high-impact news risk zones directly on trading charts, allowing traders to anticipate periods of increased risk before volatility occurs. Users can adjust the time windows before and after each event to suit their trading preferences. The tool automatically filters news relevance based on the traded symbol, providing a clean and focused overlay with upcoming or active news information. NewsGuard relies on a manually maintained high-impact news schedule, ensuring reliability and independence from external data feeds or APIs. It does not provide news feeds, forecasts, or trade signals; its sole purpose is to enhance trader awareness of time-based risk. This indicator is suitable for scalpers, day traders, and others who want to avoid entering trades blindly during major news events. Supported markets include Forex, indices, and popular symbols such as GBPUSD, XAUUSD (gold), and NAS100.
インジケーターのプロフィール
カスタマーレビュー
5.0
レビュー: 1
5 | 100 % | |
4 | 0 % | |
3 | 0 % | |
2 | 0 % | |
1 | 0 % |
カスタマーレビュー
January 16, 2026
Poor entries are easier to skip, but the tool is just one part of the process.
ディスカッション
よくあるご質問
Forex
Breakout
Scalping
Indices
GBPUSD
XAUUSD
NAS100
cTrader Storeで入手可能な取引ボット、インジケーター、プラグインなどの商品は、第三者の開発者が提供するものであり、情報と技術の取得のみを目的としてご利用いただけます。cTrader Storeはブローカーではなく、投資助言や個人的な推奨を行うことも、将来のパフォーマンスを保証することもありません。
この作成者の他の商品


価格
登録日 02/01/2026
2
販売