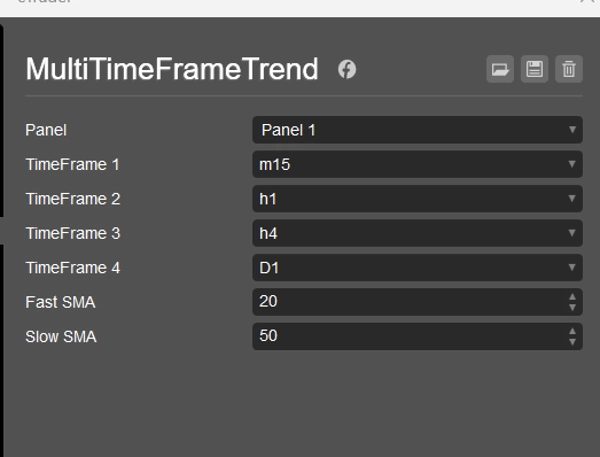
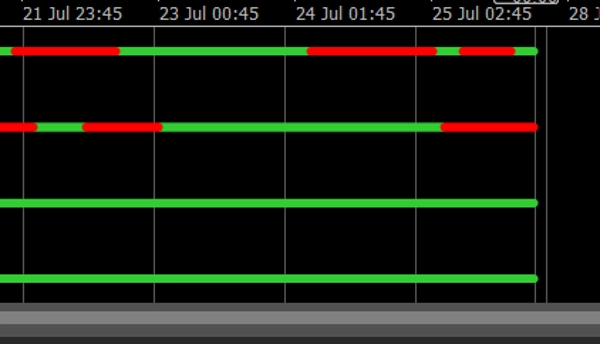
「MultiTimeFrameTrend」ロゴ
MultiTimeFrameTrend
「MultiTimeFrameTrend」アップロード画像
登録日 21/01/2025
3
販売

Multi Timeframe Trend Dots is a powerful and minimalist trend indicator built for cTrader. It allows traders to visually track trend direction across up to 4 selectable timeframes using simple but effective color-coded dot lines.

Green = Uptrend
Red = Downtrend
Clean layout in a single sub-window
Customizable SMA fast/slow settings
✅ Works on any symbol and timeframe

Whether you're a scalper, intraday trader, or swing trader, this indicator gives you a quick glance of multi-timeframe alignment — ideal for making confident entries or filtering out bad setups.

💼 Includes:

  • Trend logic based on SMA crossover
  • 4 level dot placement (adjusted for readability)
  • Timeframe labels at the end of each trend line
  • Fully compatible with all cTrader versions

🎁 Perfect companion for strategy building or manual trading.

Indicator profile
0.0
レビュー: 0
カスタマーレビュー
この商品にはまだレビューがありません。お使いになったことがある方は、ぜひレビューをお願いします。
Products available through cTrader Store, including trading bots, indicators and plugins, are provided by third-party developers and made available for informational and technical access purposes only. cTrader Store is not a broker and does not provide investment advice, personal recommendations or any guarantee of future performance.

この作成者の他の商品

Multi-Timeframe ADX Trend Dots & Arrows
Multi-Timeframe Trend Dots RSI

これも好きかも

Automatically generates support and resistance levels, both horizontal and diagonal, to reveal market trends.
Experience a new approach with amplitude-based momentum analysis. Smart Trend Detection That Adapts to Market Volatility
Relative Currency Strength 4 Currencies: AUD USD EUR JPY
Index Hunter: Momentum analysis for US30 & NAS100. Designed to identify high-velocity moves and intraday trends.
CandleColourFlow – smart color-coded trend indicator.
A comprehensive workflow‑enhancement toolkit designed to make charting on cTrader smoother, clearer, and more efficient.
A metric that can set 1 to 3 groups of Bollinger Bands
The Parabolic SAR, or "Stop and Reverse," is a dynamic technical analysis tool.
The Advanced Volume Profile Indicator calculates POC, Median, and Mode, revealing key price levels for smarter trading.
BlocksLiquidity Indicator Analysis!
10 configurable moving averages: choose type, period, color per line; single price source for all.
Bring the RMA to cTrader! This is the Relative Moving Average from TradingView.
This is the trial version of Time To Break Even, which help you time your trade entry.
The Fair Value Gap (FVG) Indicator identifies inefficiencies in price action where an imbalance occurs due to aggressive
🔹 Advanced RSI with smart alerts and visual signals for faster trend reversal detection.
Institutional Supply & Demand Mapping Across Five Timeframes — Automatically.
Professional Volume Profile Indicator - Shows volume distribution, POC, Value Areas & Buy/Sell pressure.
EMA Clouds, Multi-Timeframe (MTF) Overlay, Swing High/Low detection, and a smart Dashboard with neutral zone filtering.
登録日 21/01/2025
3
販売