
説明
SmartFibonacci — より高い時間軸のサポート、価格ラベル、近接アラートを備えた自動で設定可能なフィボナッチのリトレースメント&エクステンションで、より迅速かつ自信を持った取引判断をサポートします。
ストア向けの短い説明(1〜2行)
SmartFibonacciはスイングの高値/安値を自動検出し、チャート上に明確なフィボナッチのリトレースメントとオプションのエクステンションを描画します。設定可能な遡及期間、高時間軸のスイング検出、価格/パーセントのラベル、近接アラートにより、デイトレードのスキャルピングやスイングトレードのセットアップに最適です。
製品の完全な説明(cTraderストア用にコピー&ペースト可能)
SmartFibonacciは軽量でパフォーマンスに優れたcTraderインジケーターで、フィボナッチ分析を自動化し、レベルの描画にかける時間を減らし、取引により多くの時間を割けるようにします。設定可能な遡及期間内で最新のスイング高値と安値を特定し、リトレースメントレベルとオプションのプロジェクション(エクステンション)レベルを描画し、迅速な解釈のために価格とパーセントのラベルを表示します。堅牢なシグナルのために、SmartFibonacciは高時間軸でスイングポイントを計算しながら、現在のチャートにレベルを描画することができます。組み込みのアラート(ポップアップ+サウンド)は、価格が設定可能なピップ距離内の任意の表示されているフィボナッチレベルに近づいたときに通知します。
このリスティングには、主要なUI要素を示す明確なスクリーンショット、例示的なワークフロー、設定項目、サンプル出力(価格ラベル、エクステンション、アラート)が含まれており、購入前に機能性とユーザーエクスペリエンスを簡単に評価できます。
主な特徴
- 自動スイング検出 — 設定可能な遡及ウィンドウ内で最新のスイング高値/安値を見つけます。
- 高時間軸スイングオプション — より滑らかで意味のあるレベルのために高時間軸でスイングピボットを計算します。
- リトレースメント&エクステンション — 標準的なリトレースメントラインとオプションのプロジェクション(エクステンション)レベル(ユーザー定義のパーセント値例:127.2、161.8など)を描画します。
- 価格&パーセントラベル — 表示されている各レベルは、そのパーセントと正確な価格を表示し、迅速な意思決定を支援します。
- カスタマイズ可能なビジュアル — リトレースメント/エクステンションの色、線の太さ、線のスタイルを設定できます。
- 近接アラート — 価格が表示されているフィボナッチレベルの設定可能なピップ半径に入るとポップアップ+サウンドで通知。最も近いレベルのみをアラートするオプションもあります。
- 効率的な再描画ロジック — スイングピボットが変わったときのみインジケーターを再描画し、チャートの乱雑さとCPU使用率を削減します。
- 安全なデフォルト設定 — インストール後すぐに使いたいトレーダー向けの妥当なデフォルト値。
- cTrader / cAlgo対応 — オーバーレイインジケーターとして動作するよう設計されています。
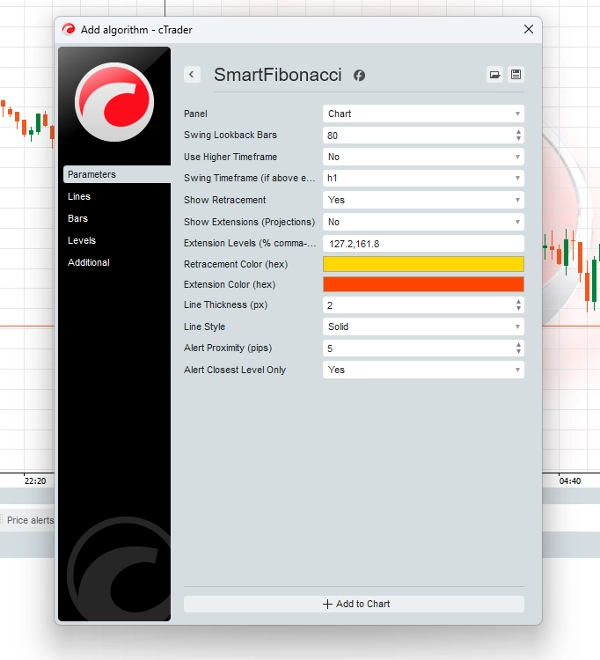
設定(パラメーター&説明)
- スイング遡及バー数(int) — スイング高値/安値を探すために遡るバー数(デフォルト80)。
- 高時間軸を使用(bool) — 現在のチャート上に描画しながら高時間軸で検出を有効にします。
- スイング時間軸(TimeFrame) —
Use Higher Timeframeが有効な場合に使用する高時間軸。 - リトレースメント表示(bool) — リトレースメントレベルの描画を切り替えます。
- エクステンション表示(bool) — エクステンション/プロジェクションレベルの描画を切り替えます。
- エクステンションレベル(string) — プロジェクションラインに使用するカンマ区切りのパーセント値(例:
127.2,161.8)。 - リトレースメント色 / エクステンション色(hex) — リトレースメントとエクステンションラインの色を選択します。
- 線の太さ(px) — 整数の線の太さ設定。
- 線のスタイル(enum) — 実線、破線などを選択します。
- アラート近接距離(ピップス) — 近接アラートの距離(ピップス単位)。
- 最も近いレベルのみアラート(bool) — 有効にすると、最も近いフィボナッチレベルのみがポップアップをトリガーします。
分析出力&UX要素
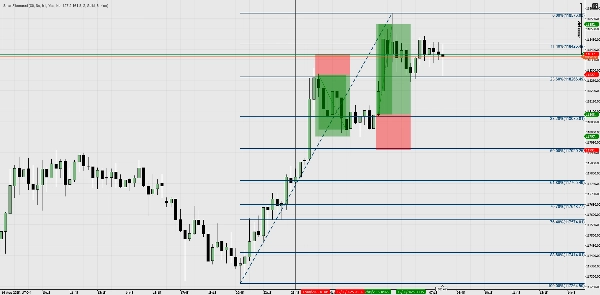
- チャート上のライン — 明確なパーセントラベル(例:61.8%)と価格ラベル(例:1.23456)付きのリトレースメントおよびエクステンションライン。
- ポップアップ通知 — 価格が
Alert Proximity範囲に入ると画面上のポップアップとシステムサウンドで通知されます。 - 非侵襲的な再描画 — 検出されたスイングが変わったときのみ更新し、頻繁な再描画のちらつきを防ぎます。
- 価格ソースの一貫性 — アラートとラベルはフィボナッチが描画されたのと同じBarsシリーズを使用して計算されます(高時間軸計算時に重要)。
例示的なワークフロー/使用シナリオ
- クイックセットアップ(スキャルピング/デイトレード)
-
- SmartFibonacciを5分足チャートに適用し、
Lookback = 80、ShowRetrace = trueに設定します。 - リトレースメントレベルを監視し、61.8% / 50%をデイトレードの反応ゾーンとして使用します。
Alert Proximity = 5 pipsを有効にして、価格が重要なレベルに近づいたときに通知を受け取ります。
- SmartFibonacciを5分足チャートに適用し、
- 高時間軸のコンテキスト(スイングトレード)
-
Use Higher Timeframe = trueに設定し、Higher Timeframe = H4(またはDaily)を選択します。- レベルはH1やM30で取引しながらH4のスイングを反映し、高時間軸の構造とより良く整合します。
- エクステンション(127.2、161.8)をスイングトレードの利益目標として使用します。
- 検証+コンフルエンス
-
- SmartFibonacciのレベルを既存のサポート/レジスタンス、構造のブレイク、移動平均線と組み合わせてエントリーを検証します。
- ポップアップアラートを使ってエントリーのタイミングを計り、インタラクションを記録してバックテストに活用します。
- アラート駆動のワークフロー
-
- 複数のチャートを監視しながらインジケーターをオンにしておき、価格が設定された表示フィボナッチレベルに近づくとポップアップを受け取り、適切に対応します。
概要
カスタマーレビュー
5 | 100 % | |
4 | 0 % | |
3 | 0 % | |
2 | 0 % | |
1 | 0 % |


