

説明
🧠 高度なRSIインジケーター – 精密なモメンタム分析
よりスマートなRSIで市場トレンドを深く理解する
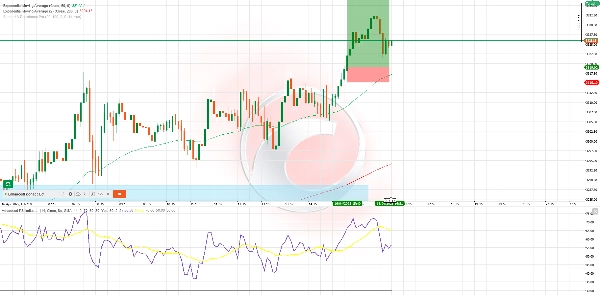
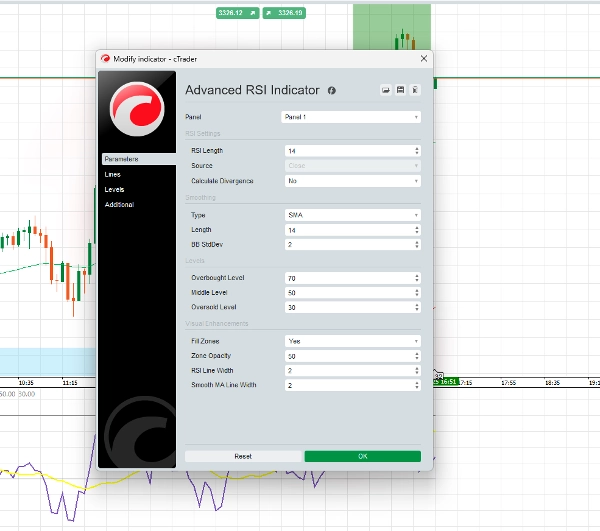
この 高度なRSIインジケーター は、精度とスマートなシグナルフィルタリングを重視するトレーダーのために開発された、クラシックなRSIツールの強力な進化版です。高度なアルゴリズムによる平滑化、適応ゾーン、統合されたダイバージェンス検出により、あらゆる市場と時間軸で洗練されたモメンタム分析を提供します。
🔍 主な特徴:
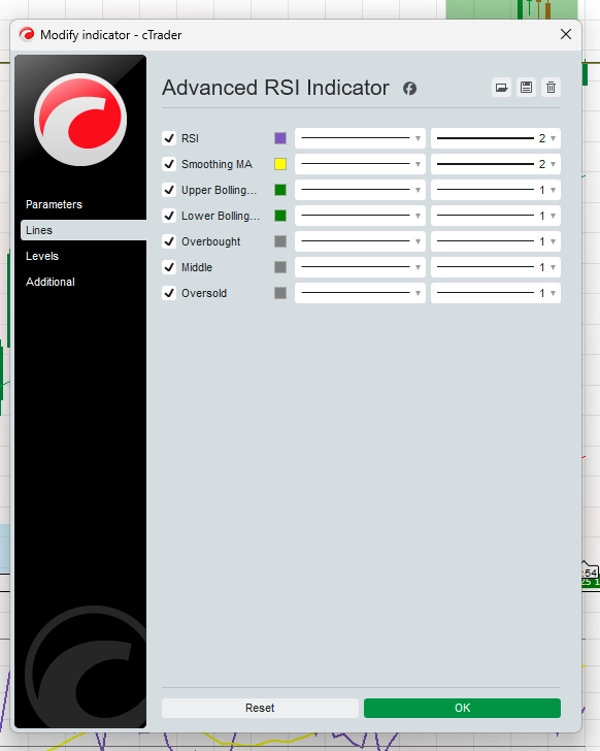
✅ 平滑化されたRSIカーブ
市場トレンドの洞察を明確にするために、ノイズの多い動きや誤ったシグナルを減少させます。
✅ 適応型シグナルゾーン
従来の70/30レベルを超え、市場のボラティリティに応じて動的に変化する閾値を提供します。
✅ 色分けされたモメンタムゾーン
直感的なビジュアルデザインで強気または弱気のモメンタムを迅速に評価できます。
✅ ダイバージェンスアラート
戦略的な意思決定を支援するために、強気および弱気のダイバージェンスのセットアップを強調表示します。
✅ カスタムアラートシステム
RSIレベルのクロスやダイバージェンスシグナルのアラートを設定し、重要な瞬間を見逃しません。
✅ マルチアセット、マルチタイムフレーム対応
FX、暗号通貨、株式、指数など、M1から日足チャートまで幅広く最適化されています。
⚙️ 戦略例 – RSIウェーブライド
最適な対象: H1 & H4 スイングトレード
使用インジケーター: 高度なRSI、50 EMA、200 EMA
買いの例:
- 価格が50および200 EMAの上にある
- RSIが40を下回り、上昇し始める
- 強気のモメンタムカラーが現れる
- (オプション)強気のダイバージェンスが検出される
- エントリー:シグナル上でのローソク足のクローズ
- SL:直近のスイング安値の下
- TP:リスクの1.5倍~2倍または直近のレジスタンス
売りの例:
- 価格が50および200 EMAの下にある
- RSIが60を超え、その後下降し始める
- 弱気のモメンタムカラーが方向を確認する
- (オプション)弱気のダイバージェンスが強さを加える
- エントリー:確認ローソク足のクローズ
- SL:直近のスイング高値の上
- TP:リスクの1.5倍~2倍または直近のサポート
💬 トレーダーがこのツールを選ぶ理由:
- 使いやすく、それでいて強力
- 再描画されないシグナル
- 主要市場でテスト済み
- 単独でも他の戦略と併用しても使用可能
概要
カスタマーレビュー
5 | 100 % | |
4 | 0 % | |
3 | 0 % | |
2 | 0 % | |
1 | 0 % |


![「[Stellar Strategies] Smart ADX」ロゴ](https://cdn.ctrader.com/image/webp/af13b084-b6f6-41db-b7bc-c7e688b57b05_36929)


