
Professional-grade Anchored VWAP
インジケーター
3 購入済
バージョン 1.0、Nov 2025
Windows、Mac
4.5
レビュー: 2
説明
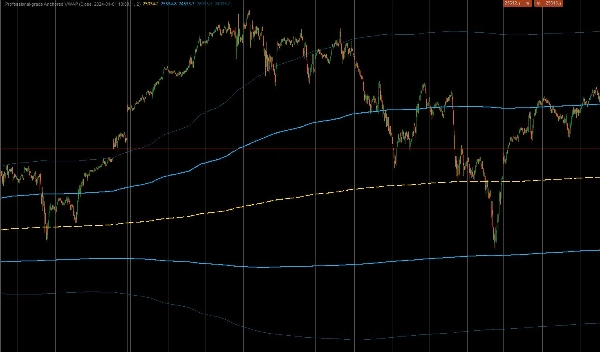
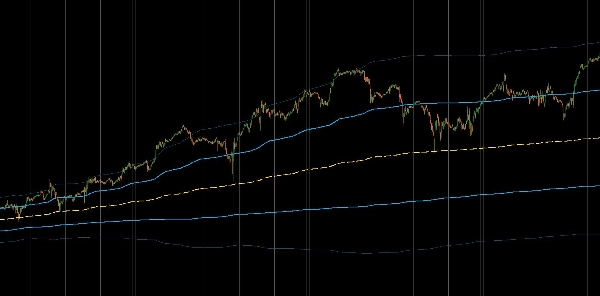
これは、cTrader向けに設計されたプロフェッショナルグレードのカスタムインジケーターで、アンカード出来高加重平均価格(AVWAP)を計算します。標準のVWAPインジケーターが日次でリセットされるのとは異なり、このツールはトレーダーがCPI発表、市場の暴落、トレンドの開始などの特定の重要なイベントに計算を「アンカー」できるようにし、その瞬間からの真の機関投資家視点の平均価格を提供します。また、過度に伸びた価格動向を特定するための出来高加重標準偏差バンドも含まれています。
1. コア計算&アンカーのロジック
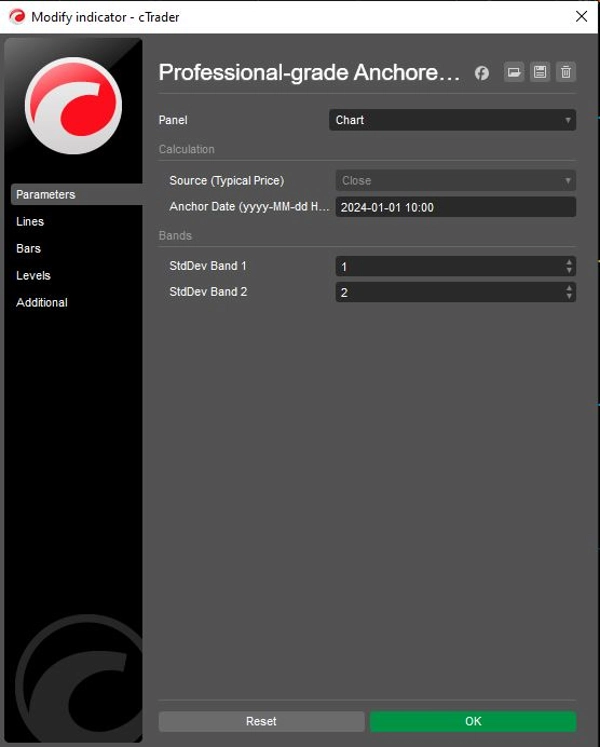
- 精密なアンカー設定: インジケーターはユーザー定義の
Anchor Date(例:「2024-01-01 10:00」)を使用し、その特定の分以前のすべてのデータを厳密に無視します。これにより、平均価格は現在の特定の動きや時間枠に関与する参加者のみを反映します。 - 機関投資家の計算式: (価格 × 出来高)の累積和を出来高の累積和で割ることで、真のVWAPを計算します。
- 標準的な価格ソース: デフォルトでは、計算に「典型価格」
(高値 + 安値 + 終値) / 3を使用します。これは機関投資家のアルゴリズムが公正価値を決定するために用いる標準的な方法ですが、開値や終値に調整することも可能です。
2. 高度なボラティリティバンド
トレーダーが市場の極端な状態を把握できるように、インジケーターは出来高加重分散に基づく2つの動的バンドを計算します:
- バンド1(バリューゾーン): デフォルトは1.0標準偏差です。この内側のゾーンは通常、市場の「公正価値」のノイズを含みます。このゾーンからのブレイクアウトはしばしばモメンタムのシグナルとなります。
- バンド2(エクストリームゾーン): デフォルトは2.0標準偏差です。この外側のバンドに達する価格は統計的に過度に伸びており、平均回帰の可能性(動きの反転)や強いトレンドの疲弊を示すことが多いです。
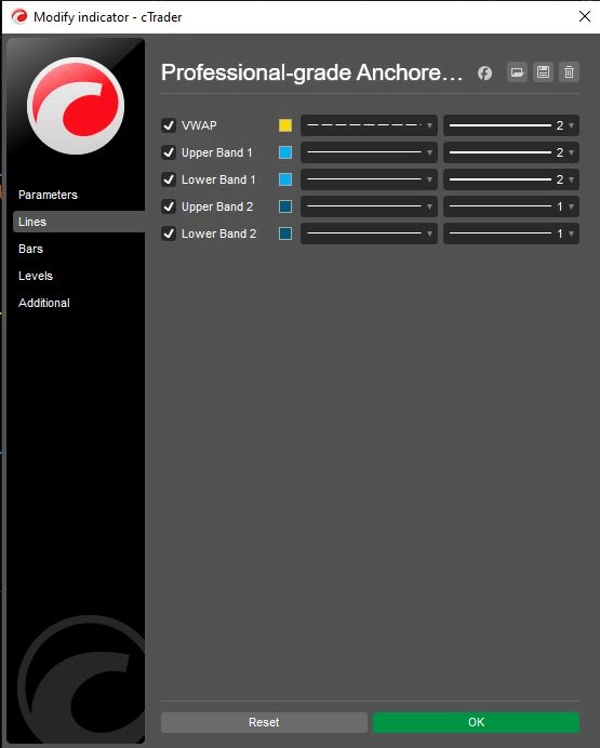
- 独立した制御: 両バンドには個別の
Showトグル(ShowBand1、ShowBand2)とカスタマイズ可能な偏差乗数(Band1Dev、Band2Dev)が含まれており、特定のボラティリティ戦略に合わせたクリーンなチャート作成が可能です。
3. ビジュアル&操作ロジック
- 戦略的な色分け:
-
- イエロー(VWAP): 中心の「磁石」またはトレンドの基準線として機能します。
- ライムグリーン(バンド1): 直近のサポート/レジスタンス「バリューエリア」を表します。
- レッド(バンド2): 反転確率が高まる極端な偏差を強調します。
- 状態の保持: コードは内部状態変数(
_cumVol、_cumPV)のためにIndicatorDataSeriesを利用し、履歴再計算やリアルタイム更新時に値が正確に保たれ、リペイントエラーを防ぎます。
ロジックフローの概要
- 初期化: ユーザー指定のAnchor Date文字列をシステムのDateTimeオブジェクトに解析します。
- 時間のフィルター: 各バーごとに現在の時間がアンカーより前かをチェックします。もしそうなら、
NaN(何も描画しない)を返し、累積カウンターをゼロにリセットします。 - データの蓄積: アンカー時間に達したら、現在のバーの出来高と(価格 × 出来高)を累積合計に加え始めます。
- VWAPの計算: 累積PV合計を累積出来高合計で割ってVWAPラインを得ます。
- 分散の計算: 出来高加重分散を計算し、標準偏差を導出します。
- バンドのプロット: 計算された偏差をVWAPに加減して、ライムとレッドのバンドを描画します。
概要
AIによる概要
This professional-grade custom indicator for cTrader calculates the Anchored Volume Weighted Average Price (AVWAP) and volume-weighted standard deviation bands from a user-defined start date. Unlike standard VWAP indicators that reset daily, it anchors the VWAP calculation to a specific event or time, such as a market release or trend start, providing an institutional perspective on average price since that anchor point.
Key features include:
- Precision anchoring to a user-specified date and time, ignoring data before that moment.
- Institutional VWAP calculation using cumulative (Price × Volume) divided by cumulative Volume.
- Default use of Typical Price ((High + Low + Close) / 3) for fair value, adjustable to Open or Close prices.
- Two dynamic volatility bands based on volume-weighted variance: Band 1 (1 standard deviation) representing the value zone, and Band 2 (2 standard deviations) indicating extreme price deviations.
- Independent toggles and customizable deviation multipliers for each band.
- Strategic color coding: yellow for VWAP, lime green for Band 1, and red for Band 2.
- Internal state preservation ensures accurate values during historical and real-time updates without repainting.
The indicator supports markets including Forex, indices, commodities, stocks, and cryptocurrencies, and is suitable for various symbols such as BTCUSD, EURUSD, GBPUSD, XAUUSD, and NAS100.
インジケーターのプロフィール
カスタマーレビュー
4.5
レビュー: 2
5 | 50 % | |
4 | 50 % | |
3 | 0 % | |
2 | 0 % | |
1 | 0 % |
ディスカッション
よくあるご質問
BTCUSD
Forex
Breakout
Indices
EURUSD
Commodities
GBPUSD
NZDUSD
Bollinger
Fibonacci
Scalping
SMC
Crypto
Stocks
XAUUSD
NAS100
USDJPY
VWAP
cTrader Storeで入手可能な取引ボット、インジケーター、プラグインなどの商品は、第三者の開発者が提供するものであり、情報と技術の取得のみを目的としてご利用いただけます。cTrader Storeはブローカーではなく、投資助言や個人的な推奨を行うことも、将来のパフォーマンスを保証することもありません。
この作成者の他の商品


価格
登録日 26/09/2025
16
販売