
DynamicVolumeSupplyDemand
インジケーター
1.29K ダウンロード数
バージョン 1.0、Apr 2025
Windows、Mac
4.2
レビュー: 5
説明
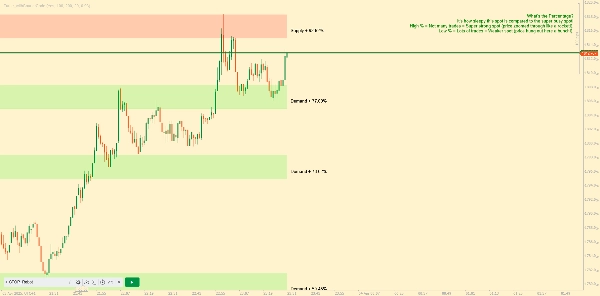
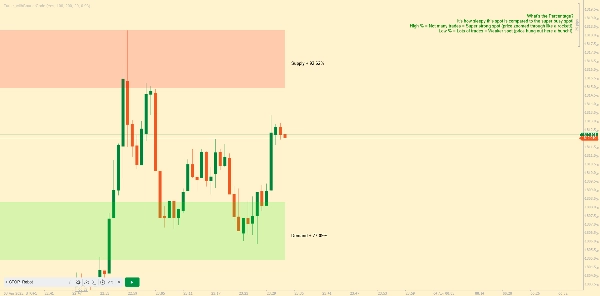
Ctraderプラットフォーム向けに私が再現したAlgoAlphaによるダイナミックな供給と需要のゾーンをご紹介します。このインジケーターは、チャート上で動的な供給と需要のゾーンを自動的に特定し視覚化するよう設計されており、トレーダーが潜在的な反転エリアを特定し、市場のセンチメントをより明確に評価するのに役立ちます。動的なルックバック機構を使用して市場状況に適応し、最近の価格変動により敏感に反応します。📈💡
主な特徴
- 📊 ダイナミックルックバック: 最新のピボットポイントに基づいてルックバック期間を自動調整し、最も関連性の高いデータを分析します。
- 🎯 ピボットポイント検出: ユーザー定義の期間を利用して重要なピボットの高値と安値を検出し、潜在的な反転ポイントを正確にマークします。
- 🛠 カスタマイズ可能なパラメーター: ルックバック期間、ピボット検出感度、解像度、ゾーン許容度などの幅広いカスタマイズオプションを提供します。
- 🗺 視覚的表示: チャート上に供給と需要のゾーンをボックスとして表示し、強気ゾーンと弱気ゾーンを区別するための背景ハイライトを行います。
- 🖍 色分けされたゾーン: ゾーンは簡単に識別できるよう色分けされており、強気は緑、弱気は赤、中立レベルは灰色です。
概要
AIによる概要
DynamicVolumeSupplyDemand is an indicator for the cTrader platform that automatically identifies and visualizes dynamic supply and demand zones on trading charts. It helps traders locate potential reversal areas and evaluate market sentiment by adapting to recent price movements through a dynamic look-back mechanism. Key features include:
- Dynamic Look-Back: Automatically adjusts the look-back period based on the latest pivot points to analyze the most relevant data.
- Pivot Point Detection: Uses a user-defined period to detect significant pivot highs and lows, marking potential reversal points.
- Customizable Parameters: Allows adjustment of look-back period, pivot detection sensitivity, resolution, and zone tolerance.
- Visual Display: Presents supply and demand zones as boxes on the chart with background highlighting to distinguish bullish and bearish zones.
- Color-Coded Zones: Zones are color-coded for clarity—green for bullish, red for bearish, and gray for neutral levels.
This indicator supports enhanced clarity in market analysis by dynamically adapting to changing market conditions and providing clear visual cues for supply and demand levels.
インジケーターのプロフィール
カスタマーレビュー
4.2
レビュー: 5
5 | 40 % | |
4 | 40 % | |
3 | 20 % | |
2 | 0 % | |
1 | 0 % |
カスタマーレビュー
October 12, 2025
Could you please make a new indicator so too remove the explanation and how the indicator works written on the chart? Very nice indicator otherwise!
August 12, 2025
Pros: Identifies dynamic supply and demand zones based on volume. Flexible settings, strong visual clarity. Cons: No alerts or tooltips. Lacks history of previous zones and user template saving.
May 15, 2025
This indicator finds the supply and demand areas very well but it has a problem. But the explanation and how the indicator works written on the chart is very annoying. I hope the designer of this software will solve this problem. Thank you
ディスカッション
よくあるご質問
cTrader Storeで入手可能な取引ボット、インジケーター、プラグインなどの商品は、第三者の開発者が提供するものであり、情報と技術の取得のみを目的としてご利用いただけます。cTrader Storeはブローカーではなく、投資助言や個人的な推奨を行うことも、将来のパフォーマンスを保証することもありません。
これも好きかも


![「[Stellar Strategies] Inside Bar with Signals」ロゴ](https://cdn.ctrader.com/image/webp/1d9e8bfa-3b2c-4440-bb37-5856902008a7_30683)


価格
登録日 09/01/2025
11.78K
無料インストール