


説明
説明と取引ルール(英語版)
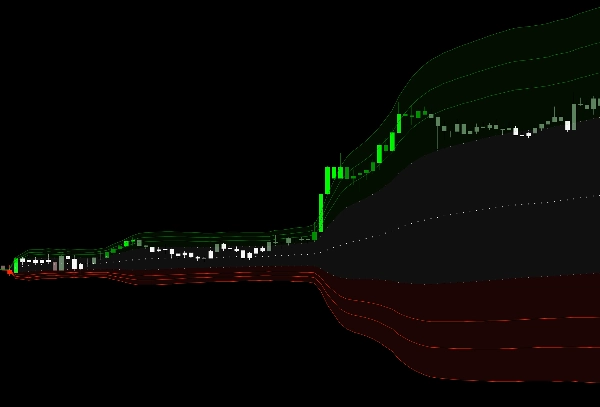
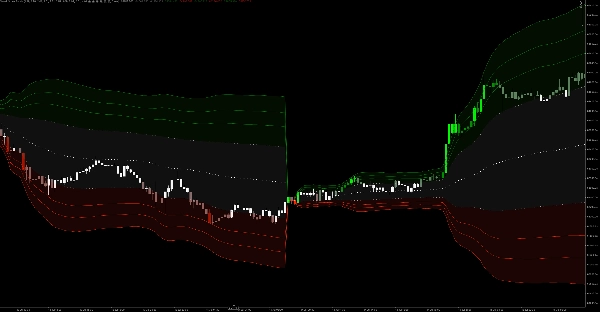
【インジケーター概要】 このインジケーターは日次VWAP(出来高加重平均価格)を中心に展開し、5段階の標準偏差(Stdev)バンドを外側に広げています。独自の「ローソク足ヒートマップ」着色技術と組み合わせることで、動的なサポートおよびレジスタンスゾーンを表示するだけでなく、極端な買われ過ぎ・売られ過ぎの市場状況を視覚的に強調し、トレーダーが平均回帰の機会を正確に捉えるのを助けます。
【取引ルール】
- 統合および観察ゾーン(白/ダークグリーン/ダークレッド): ローソク足が第1および第2の標準偏差バンド内にとどまっている場合、価格は移動平均の周りで通常の変動を示しています。トレンドフォローまたは様子見が推奨されます。
- 方向性トレンドゾーン(グリーン/ディープレッド): ローソク足が第2バンドを突破して第3バンドに入ると、トレンドは強い勢いで加速フェーズに入ります。
- 極端な反転ゾーン(ライム/ブライトレッド): ローソク足が第4または第5の標準偏差バンドに達し、色が最も明るいライムまたはレッドに変わると、極端な買われ過ぎまたは売られ過ぎの市場心理を示します。「平均回帰」(急激な反転)が高い確率で発生し、利益確定や逆張りエントリー(トップ/ボトムのフェード)に最適なシグナルとなります。
概要
AI summary
VWAP Stdev Bands is a technical indicator centered on the Daily Volume Weighted Average Price (VWAP) enhanced with five tiers of standard deviation bands. It integrates a dynamic candlestick heatmap coloring system to visually represent support and resistance levels and highlight extreme market conditions. The indicator categorizes price action into zones: a consolidation zone within the first two standard deviation bands indicating normal fluctuation; a directional trend zone beyond the second band signaling strong momentum; and an extreme reversion zone at the fourth and fifth bands, marking overbought or oversold conditions likely to precede sharp reversals. This structure assists traders in identifying mean reversion opportunities and momentum phases. The indicator supports volume and bar data inputs and provides visual outputs suitable for trend analysis, volatility regime detection, reversal signals, breakouts, and level touches or breaks. It is designed for use in markets where VWAP and volume data are available.
インジケーターのプロフィール
インジケーターのカテゴリー
トレンド
出力の種類
ビジュアル表示
データ要件
バーのみ
取引高
サポート対象のシグナル
ボラティリティ
トレンドの強さ
反転
ブレイクアウト
ラインタッチ
ラインブレイク
カスタマーレビュー
0.0
レビュー: 0
カスタマーレビュー
この商品にはまだレビューがありません。お使いになったことがある方は、ぜひレビューをお願いします。
ディスカッション
よくあるご質問
Volume
Moving Average
VWAP
Support & Resistance
cTrader Storeで入手可能な取引ボット、インジケーター、プラグインなどの商品は、第三者の開発者が提供するものであり、情報と技術の取得のみを目的としてご利用いただけます。cTrader Storeはブローカーではなく、投資助言や個人的な推奨を行うことも、将来のパフォーマンスを保証することもありません。
この作成者の他の商品






















価格
534.4M
取引数量
9.76M
獲得pips
4
販売