

AI Supertrend MTF
Indicator
3 purchases
Version 1.0, Jul 2026
Windows, Mac

534.4M
Traded volume
9.76M
Pips won
4
Sales
Description
Overview:
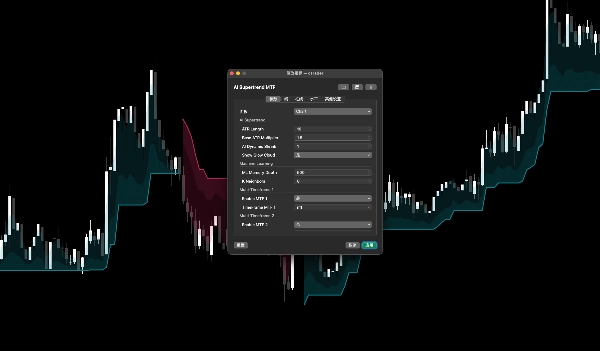
Tired of the traditional Supertrend indicator lagging behind sudden market shifts? AI Supertrend MTF redefines trend following by integrating a K-Nearest Neighbors (K-NN) Machine Learning algorithm. It continuously learns from the most recent price action (RSI, ATR, Momentum) and automatically adapts its sensitivity to eliminate false signals in choppy markets while catching massive breakouts instantly.
Key Features:
- 🤖 Machine Learning Engine: Utilizes an expanding memory bank and dynamic feature weighting to distinguish between true trends and market noise.
- 📊 Multi-Timeframe (MTF) Projection: See the bigger picture! Project up to TWO higher timeframes (e.g., 1H and Daily) directly onto your current lower timeframe chart. Engineered with rigorous bitwise logic to guarantee ZERO repainting and no future-data leaking.
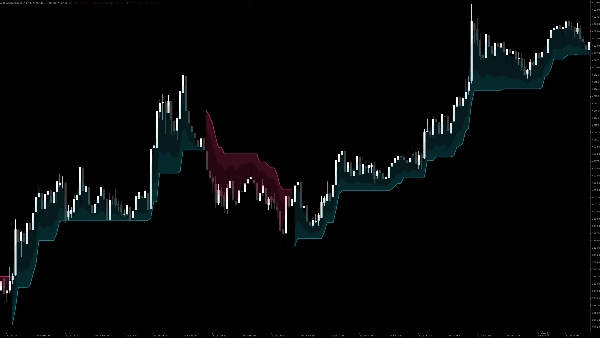
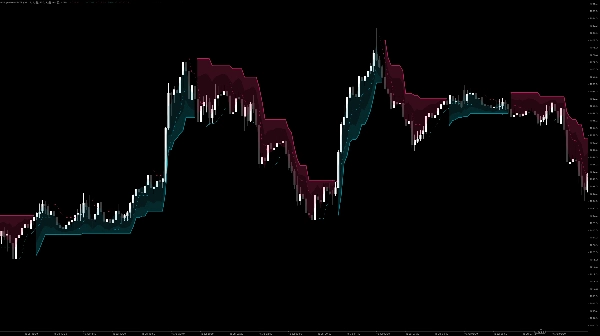
- ✨ Dynamic Glowing Clouds: A stunning visual upgrade. Displays smooth, non-intrusive 3-layer gradient clouds to visually indicate the strength and support/resistance zones of the current trend.
- ⚙️ Highly Customizable: Adjust the AI Memory Depth, K-Neighbors, and MTF granularities directly from the cTrader native parameter panel.
How to Use (User Manual):
- Attach to Chart: Apply the indicator to your favorite timeframe. The main trendline will immediately display the current AI-calculated direction.
- Enable MTF (Optional): Scroll down in the settings to
Multi-Timeframe 1andMulti-Timeframe 2. Check the "Enable" box and select your desired higher timeframes. Dashed lines will appear, showing the macro trend. - Trading Strategy:
- Buy Signal: When the main trendline flips to Cyan (below price) AND the MTF higher-timeframe lines are also Cyan (Trend Alignment).
- Sell Signal: When the main trendline flips to Red (above price) AND the MTF higher-timeframe lines are also Red.
- Exit: Use the glowing cloud bands as dynamic trailing stop-loss levels.
Summary
AI summary
AI Supertrend MTF is a trend-following indicator that integrates a K-Nearest Neighbors (K-NN) machine learning algorithm to reduce lag and false signals typical of traditional Supertrend indicators. It continuously learns from recent price action metrics including RSI, ATR, and momentum, adapting its sensitivity to distinguish true trends from market noise and to capture breakouts promptly.
Key features include multi-timeframe (MTF) projection, allowing users to overlay trend information from up to two higher timeframes onto the current chart without repainting or future data leaks. The indicator visually represents trend strength and support/resistance zones through dynamic, three-layer glowing clouds. Users can customize AI memory depth, K-neighbors, and MTF settings via the native parameter panel.
To use, apply the indicator to any timeframe to see the AI-calculated trend direction. Optional MTF lines display macro trends from higher timeframes. Buy and sell signals are generated when the main trendline and MTF lines align in color (cyan for buy, red for sell). The glowing cloud bands serve as dynamic trailing stop-loss levels.
This indicator supports visualization, signals, and filtering functions, and requires bar, tick, and volume data inputs. It is categorized under trend indicators and incorporates RSI and ATR for momentum and volatility analysis.
Key features include multi-timeframe (MTF) projection, allowing users to overlay trend information from up to two higher timeframes onto the current chart without repainting or future data leaks. The indicator visually represents trend strength and support/resistance zones through dynamic, three-layer glowing clouds. Users can customize AI memory depth, K-neighbors, and MTF settings via the native parameter panel.
To use, apply the indicator to any timeframe to see the AI-calculated trend direction. Optional MTF lines display macro trends from higher timeframes. Buy and sell signals are generated when the main trendline and MTF lines align in color (cyan for buy, red for sell). The glowing cloud bands serve as dynamic trailing stop-loss levels.
This indicator supports visualization, signals, and filtering functions, and requires bar, tick, and volume data inputs. It is categorized under trend indicators and incorporates RSI and ATR for momentum and volatility analysis.
Indicator profile
Indicator category
Trend
Output type
Visualisation
Filter
Signals
Data requirements
Bars only
Tick data
Volume
Supported signals
Cross
Breakout
Reversal
Trend strength
Volatility
Level break
Customer reviews
0.0
Reviews: 0
Customer reviews
No reviews for this product yet. Already tried it? Be the first to tell others!
Discussion
FAQ
Supertrend
RSI
ATR
Products available through cTrader Store, including trading bots, indicators and plugins, are provided by third-party developers and made available for informational and technical access purposes only. cTrader Store is not a broker and does not provide investment advice, personal recommendations or any guarantee of future performance.
More from this author






















Price
534.4M
Traded volume
9.76M
Pips won
4
Sales