
Description
Whale Hunting Indicator – Bukhari Academy
The Whale Hunting Indicator is a powerful trading tool designed specifically for Boom & Crash indices and Volatility indices. It features an Auto Trend Detector, detects bullish and bearish trends, marks market structure points (HH, HL, LH, LL), and provides high-precision buy and sell signals to help traders make informed decisions.
Key Features:
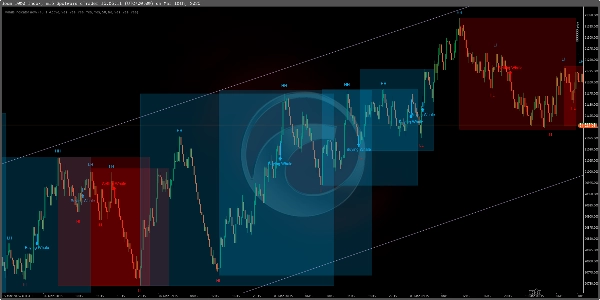
✅ Auto Trend Detector – Automatically identifies market trends, reducing the need for manual analysis.
✅ Designed for Boom & Crash and Volatility Indices – Optimized for trading these synthetic markets.
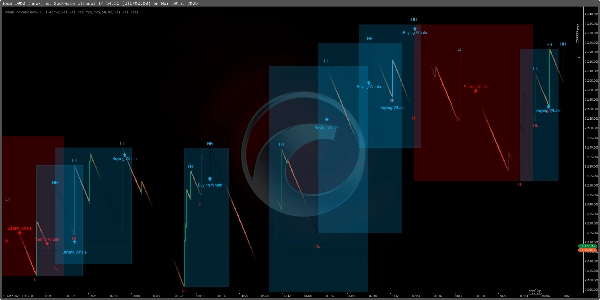
✅ Spike Detection on Boom & Crash (M1 Timeframe) – Identifies potential spikes on M1, helping traders catch rapid price movements.
✅ Trend Identification on M15 – Works effectively on M15 for normal trend analysis and structured trade setups.
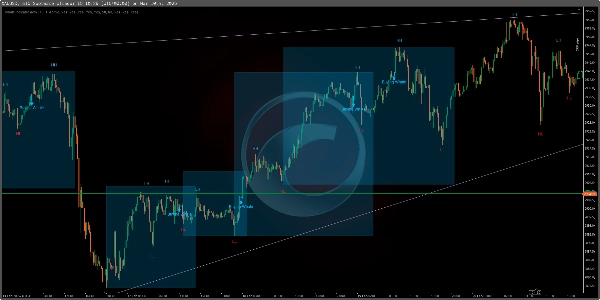
✅ Market Structure Analysis – Displays Higher Highs (HH), Higher Lows (HL), Lower Highs (LH), and Lower Lows (LL) for better trend understanding.
✅ Whale Entry Signals – Highlights "Buying Whale" and "Selling Whale" points for accurate trade entries.
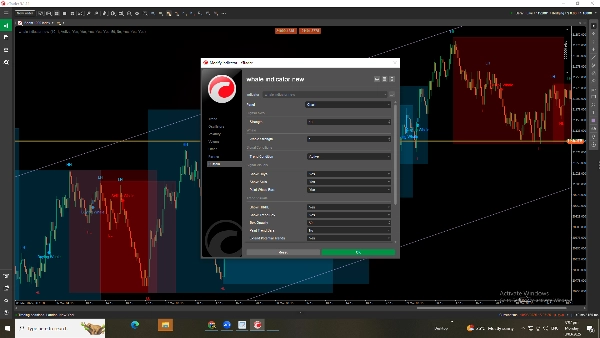
✅ Fully Customizable Settings – Adjust whale strength, signal sensitivity, and trend conditions to refine your trading approach.
✅ Enable/Disable Features – Toggle trend boxes, structure points, and buy/sell signals as needed.
How to Use the Whale Hunting Indicator?
1️⃣ Auto Trend Detection – Let the indicator automatically identify the trend direction.
2️⃣ Trade Boom & Crash Spikes on M1 – Look for signals on M1 to catch price spikes efficiently.
3️⃣ Analyze Market Trends on M15 – Use M15 for structured trend analysis and trade confirmation.
4️⃣ Follow Market Structure – Use HH, HL, LH, LL to understand trend direction and strength.
5️⃣ Look for Whale Signals – Enter trades at "Buying Whale" or "Selling Whale" points.
6️⃣ Customize for Accuracy – Adjust whale strength and signal sensitivity to optimize results.
7️⃣ Enable/Disable Features – Modify trend conditions and structure settings as per your strategy.
This indicator is perfect for Boom & Crash and Volatility indices, providing high-probability trade opportunities with precision and efficiency. 🚀
Summary
Key functionalities include spike detection on the M1 timeframe for Boom & Crash indices to capture rapid price movements, and trend identification on the M15 timeframe for structured trade setups. Users can customize settings such as whale strength, signal sensitivity, and trend conditions to refine their trading approach. Features like trend boxes, structure points, and buy/sell signals can be enabled or disabled according to user preference.
The indicator supports efficient analysis and trade execution in synthetic markets, offering tools for both short-term spike trading and longer-term trend analysis. It is suitable for traders focusing on Boom & Crash and Volatility indices who seek precise market insights and customizable signal options.
Customer reviews
5 | 33 % | |
4 | 67 % | |
3 | 0 % | |
2 | 0 % | |
1 | 0 % |


