

Description
Aggression Delta Volume Profile (True Tick Aggregation)
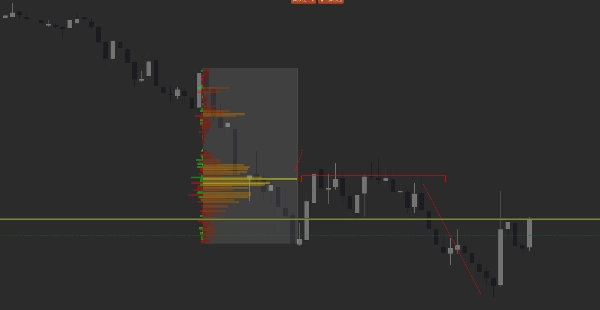
Elevate your market analysis with the Aggression Delta Volume Profile, a premium, institutional-grade Tick flow utility designed exclusively for cTrader. Unlike standard volume profiles that rely on imprecise estimations, this tool offers absolute transparency by mapping volume exactly where transactions took place.
The Problem with Standard Volume Profiles
Most volume profiles on the market use a shortcut: they take a candle's total volume and artificially distribute it across the high and low range. This creates a guessed, smoothed estimation that completely misses the hidden institutional blocks, trapped traders, and actual high-liquidity nodes.
The Aggression Delta Solution: True Tick Aggregation
The Aggression Delta Volume Profile does not guess. It leverages cTrader’s native historical tick engine to process every single raw price update within your selected area. It calculates the exact volume traded at every precise fractional price point and splits it into a real-time Buy/Sell Delta. What you see is not an approximation—it is the literal footprint of market liquidity.
Key Features
- True Historical Tick Data Processing: Utilizing millisecond-accurate tick history data to generate an uncompromised, real-time volume structure.
- Dual-Engine Anchoring Modes:
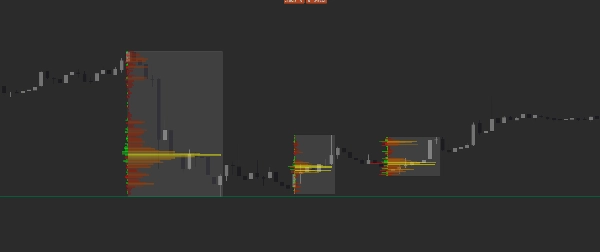
- Trendline Mode: Simply draw a standard trendline over any swing or wave to automatically wrap a localized volume profile between its start and end times. Supports multiple concurrent profiles and Left/Right alignment.
- Vertical Line (Anchor) Mode: Drop a vertical line anywhere on your chart to anchor a dynamic profile that extends from that structural key point all the way to the current live market candle.
- Trendline Mode: Simply draw a standard trendline over any swing or wave to automatically wrap a localized volume profile between its start and end times. Supports multiple concurrent profiles and Left/Right alignment.
- Advanced Volume Heatmap & Tick Flow Delta:
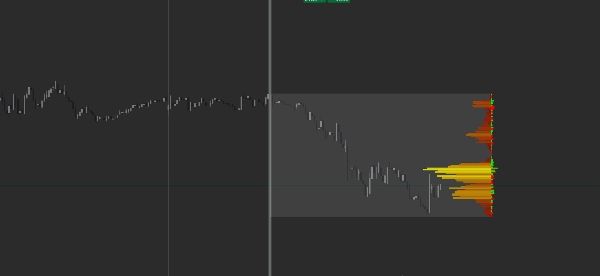
- Visualizes concentration with a smooth color gradient highlighting high-volume nodes (POC areas) versus low-volume voids.
- Features an overlapping Delta Profile (Buy vs. Sell tracking) based on tick-by-tick aggressive market orders, showing you instantly who is in control of a specific price level.
- Visualizes concentration with a smooth color gradient highlighting high-volume nodes (POC areas) versus low-volume voids.
- Flicker-Free UX Optimization: Built with asynchronous data loading states and smart caching architecture to ensure your charts stay incredibly smooth, responsive, and clear of UI lag during heavy market volatility.
- True Historical Tick Data Processing: Utilizing millisecond-accurate tick history data to generate an uncompromised, real-time volume structure.
How to Use It
- Trendline Profiling: Draw a trendline to isolate a specific trading session, news event, or corrective wave. The indicator hides the trendline automatically and replaces it with a beautiful, custom-fitted volume profile. Choose exactly how many trendlines convert into volume profiles. Any additional trendlines you draw beyond that limit will automatically function as standard chart lines.
- Vertical Anchor Profiling: Place a vertical line at a major swing high/low, session open, or macroeconomic release time. The profile will dynamically update with every incoming tick, projected neatly to the right side of your chart with customizable offsets so it never blocks your price action. Only the most recent vertical line acts as your dynamic profile anchor. Any secondary vertical lines you place on the chart will automatically remain standard, unaltered vertical lines.
- Trendline Profiling: Draw a trendline to isolate a specific trading session, news event, or corrective wave. The indicator hides the trendline automatically and replaces it with a beautiful, custom-fitted volume profile. Choose exactly how many trendlines convert into volume profiles. Any additional trendlines you draw beyond that limit will automatically function as standard chart lines.
Technical Specifications & Parameters
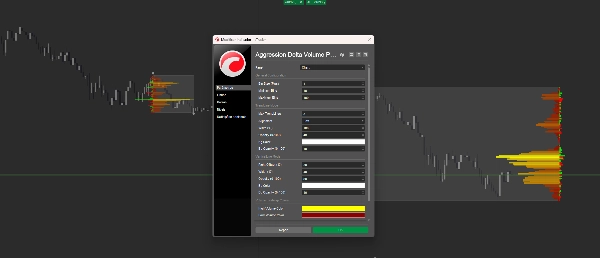
- Bin Size (Pips): Completely customizable granularity (from micro-scalping $0.1$ pips to macro-structures).
- Bin Thresholds: Set minimum and maximum limits to keep the layout clean regardless of market volatility.
- Aesthetics Control: Full control over transparency, background fills, heatmap gradients, and Delta colors to match any dark or light chart theme perfectly.
- Bin Size (Pips): Completely customizable granularity (from micro-scalping $0.1$ pips to macro-structures).
Why Choose This Indicator?
If you trade support/resistance breakouts, auction market theory, or institutional order blocks, guessing volume distribution is costing you money. Give yourself the definitive edge with an indicator that transforms raw tick data into actionable, high-probability execution zones.
Get the Aggression Delta Volume Profile today and start seeing the real market.
Summary
Key features include two anchoring modes: Trendline Mode, which creates localized volume profiles between drawn trendline points, and Vertical Line Mode, which anchors dynamic profiles from a chosen price level to the current market. The indicator visualizes volume concentration with a heatmap highlighting high-volume nodes and overlays a Delta Profile to track aggressive buy versus sell orders. It supports customizable bin sizes and thresholds for granular volume analysis and offers full aesthetic controls for integration with various chart themes.
The indicator is optimized for smooth performance with asynchronous data loading and caching to maintain responsiveness during volatile market conditions. It is suited for traders focusing on support/resistance breakouts, auction market theory, and institutional order blocks by providing actionable insights based on exact tick-level volume data.
























!["[Stellar Strategies] Inside Bar with Signals" logo](https://cdn.ctrader.com/image/webp/1d9e8bfa-3b2c-4440-bb37-5856902008a7_30683)
