"Smart Donchian Cloud" logo
Indicator
Version 1.0, Apr 2026
Windows, Mac
5.0
Reviews: 1
"Smart Donchian Cloud" uploaded image
Since 14/02/2025
9
Sales

Institutional Support & Resistance Visualizer

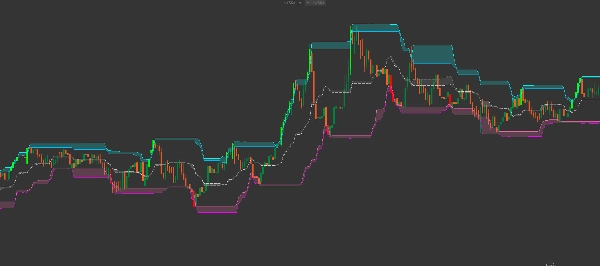
The Smart Donchian Cloud Reversal is a next-generation volatility channel designed to identify high-probability reversal zones. Unlike standard Donchian Channels that only track the highest highs and lowest lows, this indicator analyzes the relationship between candle wicks and candle bodies to plot "Pressure Clouds."

These clouds act as dynamic zones of Supply and Demand, showing you exactly where the market is likely to stall or reverse.


Advanced Multi-Cloud Architecture

This indicator features a sophisticated 3-layer cloud system:

    1. The Resistance Cloud (Cyan/Blue): Located at the top, it visualizes the gap between the highest wick and the highest candle body. This is the "Selling Zone."
    2. The Equilibrium Cloud (Gray/Silver): A central ribbon that tracks the balance of the market. It represents the fair value midpoint between wicks and bodies.
    3. The Support Cloud (Pink/Magenta): Located at the bottom, it visualizes the gap between the lowest wick and the lowest candle body. This is the "Buying Zone."


Key Trading Features

    • ATR Volatility Filter: Includes a built-in ATR (Average True Range) multiplier to slightly offset the outer bands, filtering out market noise and "stop-hunts."
    • Smart Candle Painting: The indicator automatically highlights breakout momentum:
    • LIME Candles: Price has closed above the Upper Resistance Cloud (Bullish Breakout).
    • RED Candles: Price has closed below the Lower Support Cloud (Bearish Breakout).
    • Wick vs. Body Logic: By seeing the "cloud" thickness, you can gauge the volatility. A thick cloud means long wicks (high rejection/indecision), while a thin cloud means strong, decisive price action.


How to Trade with Smart Donchian Clouds

1. The Mean Reversion (Scalping) » Look for price to enter the Resistance Cloud without closing above it. This often indicates a "fakeout," signaling a high-probability short entry back toward the Mid-Line.

2. The Trend Breakout » When a candle turns Lime (closing above the upper wick filter), it signals that the bulls have cleared the resistance zone. This is a powerful signal for trend-following strategies.

3. The Support Bounce »Watch the Support Cloud (Pink). When price touches this zone during a pullback in an uptrend, it represents a "Value Buy" area where institutional buyers often step in.


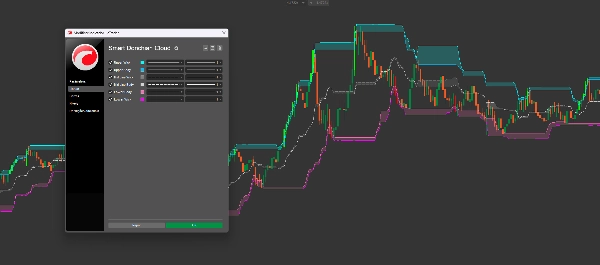
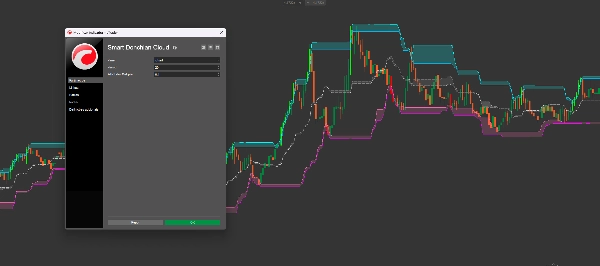
Technical Parameters

    • Period: The lookback period for calculating highs and lows (Default: 20).
    • ATR Filter Multiplier: Adjusts the "padding" around the extremes to avoid being caught in minor spikes.
    • Fully Customizable Colors: Tailor the Upper, Mid, and Lower clouds to fit your personal chart template.


Why This Tool is Essential

Most traders fail because they treat Support and Resistance as single lines. In reality, they are Zones. The Smart Donchian Cloud Reversal maps these zones mathematically, giving you a clearer picture of market structure than any traditional channel indicator.

Indicator profile
Indicator category
Support & resistance
Output type
Visualisation
Filter
Data requirements
Bars only
Supported signals
Breakout
Reversal
Trend strength
Level touch
Level break
5.0
Reviews: 1
5
100 %
4
0 %
3
0 %
2
0 %
1
0 %
Customer reviews
April 27, 2026
Premium/Discount
Donchian Channels
Market Structure
Supply & Demand
Channel
ATR
Support & Resistance
Products available through cTrader Store, including trading bots, indicators and plugins, are provided by third-party developers and made available for informational and technical access purposes only. cTrader Store is not a broker and does not provide investment advice, personal recommendations or any guarantee of future performance.

More from this author

Indicator
ATR
Key Levels
It combines the trend-filtering power of Renko charts with the volatility tracking of ATR Bands
Indicator
ATR
RSI
+5
Delta RSI Candle Pro, the indicator that transforms ordinary candlesticks into powerful momentum visualizers.
Indicator
ATR
Volume
+4
This allows traders to see not just the trend, but whether the momentum itself is overextended.
Indicator
ATR
SMC
+5
Candles Volume Delta is a powerful, visually intuitive indicator that transforms raw tick volume into actionable trading
Indicator
VWAP
Moving Average
Vwap Bands it is highly sought after by professional traders because it includes Standard Deviation Bands
Indicator
ATR
VWAP
+2
Volume-Weighted Trend System that combines VWMA with ATR for volatility filtering.
Indicator
Channel
Moving Average
+2
This is a high-quality implementation of the Squeeze Momentum Candle logic applied directly to candle coloring.

You may also like

Indicator
BOS
CHOCH
+5
Smart Money Concepts Automate your institutional analysis and make decisions with pinpoint precision..
Indicator
ADX
ATR
+5
10 Factors. One Signal. Zero Guesswork.
Indicator
AI
ATR
+23
Candle Timer best used for Scalper
Indicator
Prop
Forex
+13
Identifies market compression zones and explosive Breakout moments using mathematical modeling.
Indicator
AI
ATR
+27
The Support & Resistance Pro helps traders identify key support and resistance levels for informed trading decisions.
Indicator
Plot higher-timeframe Bollinger Bands for clearer structure, pullback zones, and breakout signals—without switching char
Indicator
Prop
Forex
+5
Transform your approach to trading with our innovative Pivot Point Indicator.
Indicator
RSI
MACD
Unlock market insights with our Multi-Timeframe Market Levels indicator, enhancing your trading strategies effortlessly
Indicator
Prop
Forex
+4
Displays real-time balance, equity, P&L, margin metrics directly on your charts.
Indicator
Indices
Commodities
The Advanced CCI & EMA Indicator combines the CCI with 40 & 80 EMA logic to generate precise arrows signaling direction
Indicator
BOS
Fibonacci
+4
Automatically draws major trading sessions, killzones, and SMC daily liquidity targets directly on your cTrader charts.
Indicator
EMA
Supertrend
+4
Dynamic dual MA cloud indicator. Identifies trends, crossovers, and pullback entries in real time for any asset.
Indicator
ATR
SMC
+5
Candles Volume Delta is a powerful, visually intuitive indicator that transforms raw tick volume into actionable trading
Indicator
Market Structure
Support & Resistance
Auto-centers price when it moves beyond threshold. Adjustable zoom. Works on any chart type. Never lose price again.
Indicator
Breakout
FlexSR auto‑detects pivot highs/lows to plot dynamic support & resistance lines Features customizable styling and option
Indicator
ATR
Market Structure
+3
Support Resistance Toolkit
Indicator
ATR
BTCUSD
+5
Trailing algo 📈 auto-tracks trends 🎯 adapts to volatility 🌟 precise moves 🛡️ retest signals 🚀 no lag, smart market
Indicator
ATR
Channel
+1
Bollinger Bands Advanced Squeeze & Breakout System, Real-Time On-Chart Dashboard, Auto-Squeeze Detector, Dual-Band Cloud
Since 14/02/2025
9
Sales