

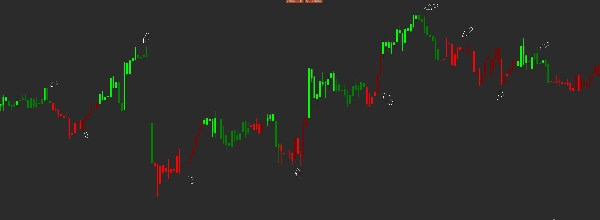
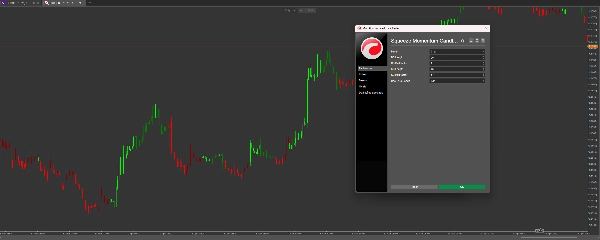
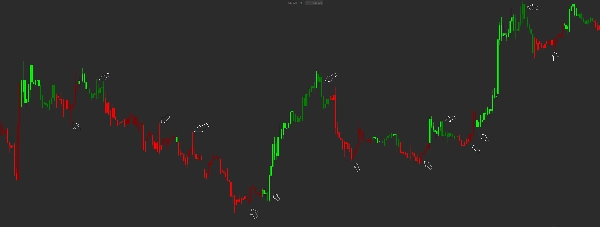
Description
Master Market Volatility Without Chart Clutter
The Squeeze Momentum Candle Painter is a sophisticated volatility and momentum indicator based on the classic TTM Squeeze logic. Instead of filling your screen with oscillators, this tool intelligently colors your price bars, allowing you to identify high-probability explosive moves and trend shifts while keeping your main chart clean and professional.
Overview
The market transitions between two states: Compression (Squeeze) and Expansion (Volatility). This indicator uses the relationship between Bollinger Bands and Keltner Channels to identify these phases, combined with a Linear Regression momentum algorithm to determine trend direction and strength.
Key Features
- Intuitive Color Coding: Instantly recognize trend momentum through 4 distinct candle colors.
- TTM Squeeze Algorithm: Built-in calculation of price compression and momentum slope.
- Clean UI Design: Eliminates the need for a separate histogram window, giving you more space for price action analysis.
- Fully Customizable: Adjust Bollinger Band and Keltner Channel parameters to fit any timeframe or asset class (Forex, Indices, or Crypto).
- Zero Lag Logic: Uses linear regression to detect momentum shifts faster than traditional moving averages.
How to Read the Colors :
- Lime » Strong upward momentum (Increasing)
- Green » Weakening upward momentum (Slowing down)
- Red » Strong downward momentum (Increasing)
- Maroon » Weakening downward momentum (Slowing down)
The Trading Strategy
The Build-up: When momentum is low (Maroon or Green), the market is often "squeezing" or consolidating.
The Breakout: Look for a transition from Green to Lime (Bullish) or Maroon to Red (Bearish). This indicates momentum is accelerating.
The Exit: When a Lime candle turns Green, or a Red candle turns Maroon, it signals that the current move is losing steam—a perfect time to take profits or tighten Stop Losses.
Why Choose This Indicator?
Most traders fail because they react too late. The Squeeze Momentum Candle Painter visualizes the "internal" energy of the market. By watching the candle colors shift, you gain a psychological edge, staying in winning trades longer and exiting before the reversal hits.
Summary
Key features include intuitive color coding of candles into four states—strong upward momentum (lime), weakening upward momentum (green), strong downward momentum (red), and weakening downward momentum (maroon)—which visually represent trend momentum without cluttering the chart with oscillators or histograms. The indicator’s parameters for Bollinger Bands and Keltner Channels are fully customizable to suit various timeframes and asset classes such as Forex, indices, and cryptocurrencies.
Traders can interpret the color transitions to identify consolidation phases, breakout points, and momentum weakening, aiding in entry and exit decisions. This tool integrates volatility regime, trend strength, and reversal signals into a clean, easy-to-read visualization directly on price bars.
Customer reviews
5 | 100 % | |
4 | 0 % | |
3 | 0 % | |
2 | 0 % | |
1 | 0 % |
























