
Renko Reversal
Indicator
14 purchases
Version 1.2, Apr 2026
Windows, Mac
4.3
Reviews: 3
Description
Unlock High-Quality Entry Points with the Renko Reversal Indicator for cTrader
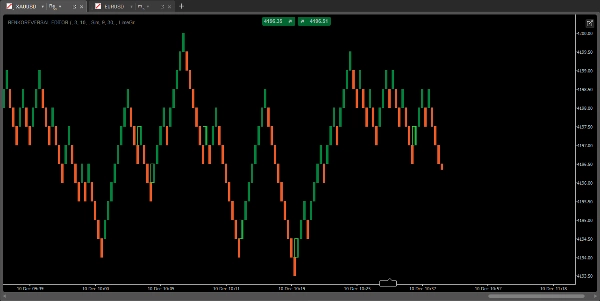
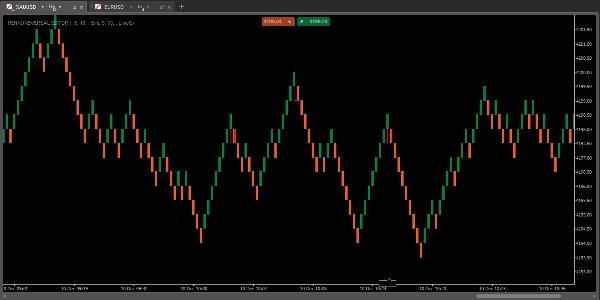
The Renko Reversal Indicator is your ultimate tool for capturing trend continuations with precision on Renko charts. Designed to cut through noise and focus solely on the strongest opportunities, this indicator goes far beyond a simple block color change.
How It Gives You an Edge (The Exclusive Filters):
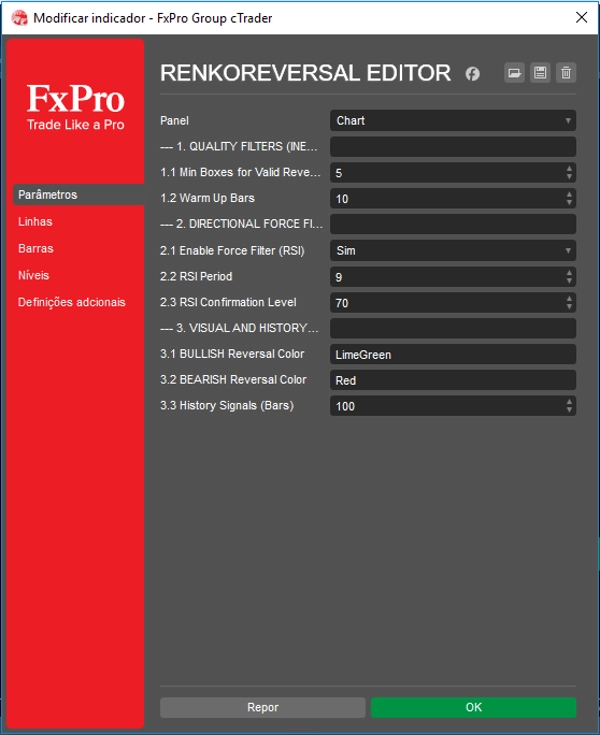
- Inertia Filter: Stop trading weak pivots! We require a minimum box inertia during the correction. The indicator only signals when the retracement was deep enough, validating the strength of the reversal.
- Directional Force Filter (RSI): The signal is double-validated by momentum. The continuation is only confirmed if the RSI indicates that the force is in the new direction's territory (above/below the level 50), ensuring you enter the market precisely when the new momentum begins.
Trade with Confidence:
Focus on clean momentum shifts and enter the market with higher conviction. With fully adjustable parameters (Inertia, RSI Period, and Level), you can customize the sensitivity for any pair or trading style.
Install today and transform the way you trade trend continuation.
Summary
AI summary
The Renko Reversal Indicator for cTrader is designed to identify potential trend reversal points on Renko charts by analyzing price changes and the average True Range (ATR). It visually signals possible reversals by changing the color of Renko blocks. The indicator incorporates two key filters to enhance signal quality: an Inertia Filter that requires a minimum box inertia during corrections to confirm strong reversals, and a Directional Force Filter using RSI to validate momentum shifts, signaling entries only when RSI crosses the midpoint level 50 in the new trend direction. Parameters such as Inertia, RSI period, and RSI level are fully adjustable, allowing customization for different trading styles and instruments. This indicator supports various markets including Forex, cryptocurrencies, commodities, indices, and stocks, with tags referencing symbols like BTCUSD, EURUSD, GBPUSD, XAUUSD, NAS100, and USDJPY. It is intended to assist traders in capturing trend continuations with higher precision by focusing on clean momentum shifts on Renko charts.
Indicator profile
Customer reviews
4.3
Reviews: 3
5 | 33 % | |
4 | 67 % | |
3 | 0 % | |
2 | 0 % | |
1 | 0 % |
Customer reviews
March 2, 2025
Useful if not rushed for traders who like filtered price action. It gives value around Renko chart setups, but brick charts can hide useful detail. A fair Renko test needs 25 signals, 1R exits and a check for late reversal bricks. The chart looks cleaner, but it still needs normal price context.
March 1, 2025
March 1, 2025
Clear trading aid for Renko chart setups. it cuts down candle noise and makes direction easier to read, especially when used for filtering price movement into cleaner swings. I would check 10 to 15 bricks before trusting the direction and confirm it on normal candles. The chart looks cleaner, but it still needs normal price context.
Discussion
FAQ
BTCUSD
Forex
Signal
Breakout
Indices
EURUSD
Commodities
GBPUSD
NZDUSD
Prop
ZigZag
Scalping
Crypto
Stocks
XAUUSD
NAS100
USDJPY
Products available through cTrader Store, including trading bots, indicators and plugins, are provided by third-party developers and made available for informational and technical access purposes only. cTrader Store is not a broker and does not provide investment advice, personal recommendations or any guarantee of future performance.


Price
Since 05/02/2025
31
Sales