"ATR" logo
ATR
"ATR" uploaded image
Since 05/02/2025
21
Sales

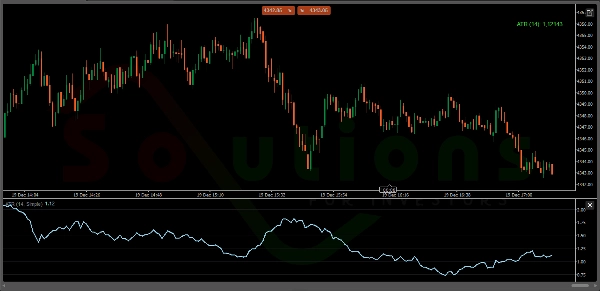
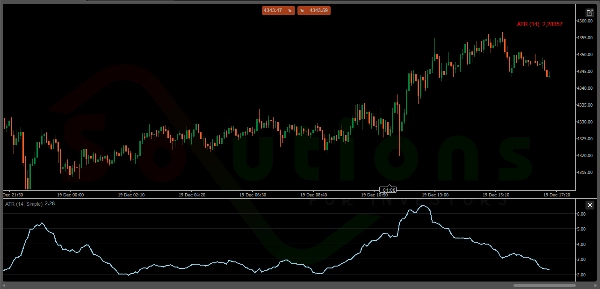
ATR – Volatility and Visual Precision

ATR is the essential tool for traders looking to master market range. This optimized version for cTrader offers an immediate reading of volatility, turning complex data into actionable visual insights.

Highlights:

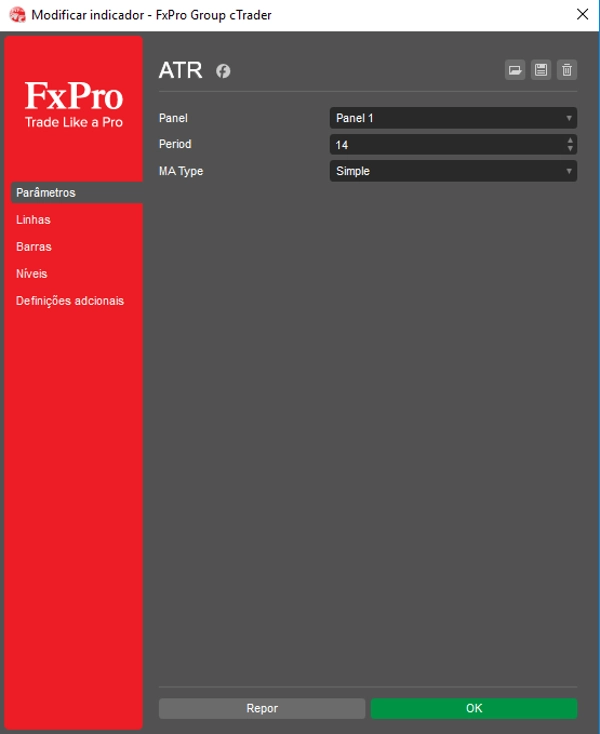
  • Real-Time Dashboard: Exact ATR value displayed directly on the chart for quick Stop Loss calculations.
  • Smart Signaling: Dynamic text that turns Green in high-range markets and Red when the market loses momentum.
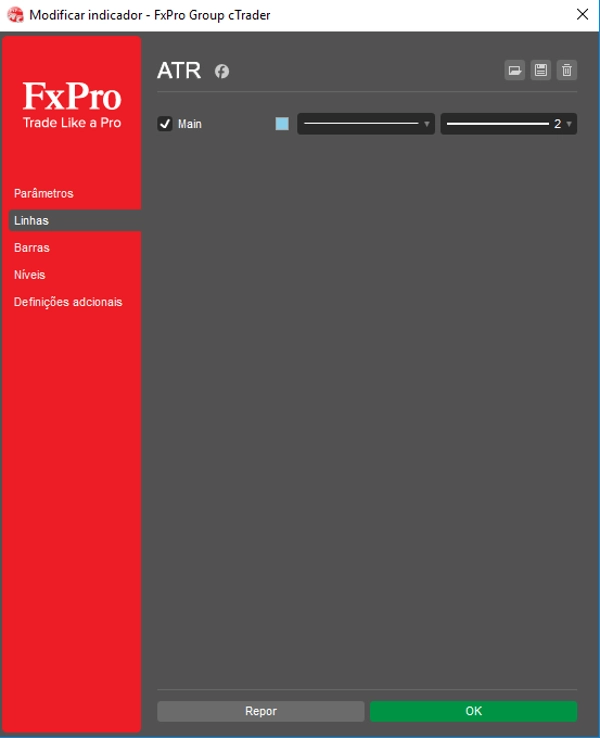
  • Clean Interface: Minimalist design that integrates perfectly with any technical analysis setup.
  • Senior Optimization: Lightweight code compatible with the latest cTrader version (5.5.13).

The foundation of your risk management, now with total visual clarity.

Indicator profile
0.0
Reviews: 0
Customer reviews
No reviews for this product yet. Already tried it? Be the first to tell others!
BTCUSD
Forex
Signal
Breakout
Indices
EURUSD
Commodities
GBPUSD
NZDUSD
Prop
Scalping
ATR
Crypto
Stocks
XAUUSD
NAS100
USDJPY
Products available through cTrader Store, including trading bots, indicators and plugins, are provided by third-party developers and made available for informational and technical access purposes only. cTrader Store is not a broker and does not provide investment advice, personal recommendations or any guarantee of future performance.

More from this author

The best filter for trading trend continuations on Renko charts.
Color Volume Bars – Visualize Market Strength Instantly
VIX Pro: Volatility Index Tool with ATR-Based Breakout Alerts
Automatically plots Fibonacci retracement levels using the highest and lowest points of a customizable time range
VWAP: Follow the smart money. Trade with real volume and the fair price on your side!
RSI Pro Tool – Overbought & Oversold Made Easy
Spot strong trends and market direction with precision using this professional-grade ADX indicator.
Filter noise & catch real trends! ADX Pro: precise signals with 3 risk profiles and exhaustion protection. Trade power.

You may also like

JMA-like is a highly responsive and ultra-smooth moving average designed to replicate the behavior of the original JMA!
Volumen Delta", es una representación visual del flujo de órdenes basada en el volumen de transacciones.
The standard Relative Strength Index (RSI), RSI & Signal Cloud, Smart Volatility Filter (ATR), On-Chart Info Dashboard
Enhance trading with TSI! Use the True Strength Index for clear insights into market momentum and trend strength.
Volume profiler applying Wyckoff effort vs result and spread analysis with visual bar graphs.
Color-Based Market Pressure & Volatility Visualizer The Kandika Heatmap Indicator
Connects each moving average value from candle to candle, forming a fan-like structure of trendlines.
show symbol and time fram, daily net profit percent, daily net profit, and spread ln your chart. consider that timezone
Detects CHoCH breakouts, draws interest zones & auto Fibo. Built for Smart Money & Price Action Engulfing confirmation
Your Chart in a Strategic Decision Center!
Awesome Oscillator with instant zero-line cross alerts. Includes chart popup + sound notification
Market entropy + DC. Spot crystallization/chaos shifts with an optional on-chart overlay.
SmartZig — Dual Market Structure ZigZag: Clean Body-Based Pivots, Invisible Chart Mode & Draggable Timeframe Inspection
A Fair Value Gap (FVG) indicator that identifies potential price imbalances, potential reversal and continuation zones
Draws support and resistance on all pairs.
The ZigZag Trend is a market structure tool that filters out small price fluctuations and highlights major swing.
A metric that can set 1 to 3 groups of Bollinger Bands
An indicator that redefines ATR by applying a percentile-based filter giving traders a grounded view of volatility.
Since 05/02/2025
21
Sales