Indicator
RSI
Indices
RSI
"RSI" logo
15/09/2025
Desktop
"RSI" uploaded image"RSI" uploaded image"RSI" uploaded image


Custom RSI – Spot Reversals with Precision and Clean Visuals


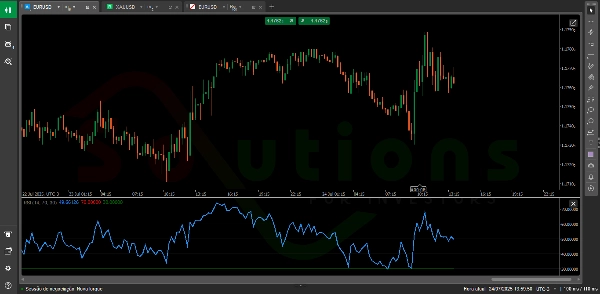
Custom RSI is an enhanced version of the classic Relative Strength Index (RSI), designed to help traders quickly identify overbought and oversold zones—key areas where price is likely to reverse.

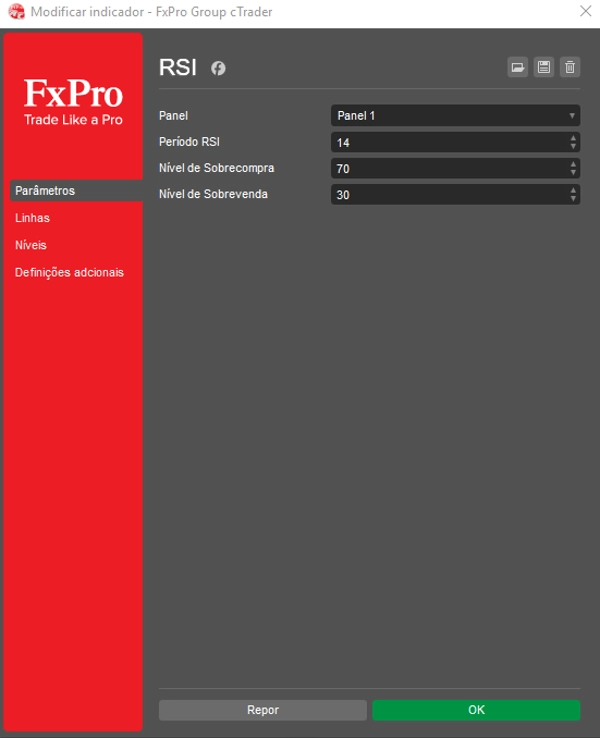
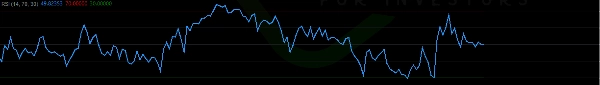
With a clean and intuitive interface, it displays two fully customizable horizontal lines (like the traditional 70 and 30 levels), clearly marking high-probability decision points on the chart.

Adjust the timeframe and RSI levels to fit your trading style
Identify potential reversal zones with greater confidence
Enhance your technical analysis with a clear, no-clutter indicator

Perfect for traders of all levels, Custom RSI transforms raw price data into smart, actionable insights—making it an essential tool for profitable decision-making.

0.0
Reviews: 0
Customer reviews
No reviews for this product yet. Already tried it? Be the first to tell others!
More from this author
Renko Reversal
Renko Reversal catches powerful wick rejections on cTrader.
VolumeColorBar
Color Volume Bars – Visualize Market Strength Instantly
Indicator
Breakout
VIX - volatility indicator
Ride the Volatility – Smart VIX Tool
Automatic Fibonatti
Automatically plots Fibonacci retracement levels using the highest and lowest points of a customizable time range
Indicator
Indices
Prop
Commodities
+3
ADX Indicator_noSourceCode
Identify Trend Strength with Absolute Precision on cTrader
Automatic Fibonatti - Renko
Automatically plots Fibonacci retracement levels using the highest and lowest points of a customizable time range.
Indicator
Breakout
VIX - volatility indicator - Renko
Volatility indicator for Renko.
BOT REJECTION - SOLUTIONS FOR INVESTORS
Rejection Bot – Precision Trading at Key Levels
You may also like
Indicator
Indices
Stocks
Forex
+1
TwoSMA.cs
An indicator that accurately shows the trend direction. A vital tool for clear trading decisions.
Indicator
Signal
dark-cloud
The Dark Cloud Cover indicator detects a bearish reversal pattern, marking key candles and confirming signals based on v
Indicator
NAS100
NZDUSD
XAUUSD
+13
MACD Crossover PRO
Customize the MACD! Choose colors, get real-time tick updates, and see crossover points for enhanced trading precision.
LT_FairValueGap
Detects valid Fair Value Gaps from strong 3-bar patterns. Keep drawing unfilled gaps until price fills them.
VixFix
A volatility spike detector based on Larry Williams’ VIX Fix. Highlights market fear moments with clear histogram signal
Indicator
RSI
Breakout
XAUUSD
+5
Auto-Trend Channel
Adaptive trend channel using linear regression and Pearson correlation for dynamic support, resistance, and trends.
Indicator
Signal
MACD
TradingViewMACD
Enhance your trading strategy with our customizable TradingViewMACD indicator. Optimize and elevate your market analysis
VegaXLR - Auto Support and Resistance
cTrader Auto Support & Resistance detects key levels with Fibonacci analysis and sends real-time trading alerts.
Indicator
NAS100
NZDUSD
XAUUSD
+10
Tsunami Volume Surge - RVOL
🌊 See when the market is truly in play. Tsunami measures Relative Volume by time-of-day 🌊
Indicator
Signal
MACD
USDJPY
PulseTracker
Version 1.2: Advanced Trend Detection & Visualization System
Indicator
Indices
RSI
Bollinger
Clustering
Clustering tool for traders with visual insights into market patterns.
Indicator
Indices
Stocks
Commodities
+2
SymbolTFOverlay
The SymbolTFOverlay display the current symbol and timeframe as a semi-transparent text overlay on the chart.
Indicator
Bollinger
Repiptor BB Colored Width
Colored Bollinger Bands Width
E7 cTrader User ID
cTrader ID
VWAP
Track VWAP for Asia, London, NY, Sydney, Daily, Weekly, Monthly & Custom Sessions. Perfect for FX & intraday trading!
AlphaTrend Pro by LudwigICT
Indicator
XAUUSD
Commodities
FVG_tidypips
A Fair Value Gap (FVG) indicator that identifies potential price imbalances, potential reversal and continuation zones
IR Open Connector
This indicator connects the opening prices of higher timeframe candles (Daily, Weekly, Monthly, or