
Description
One of the biggest mistakes new traders make is that they try to create as much information as possible to a chart by adding too many indicators and the result is a chart full of noise with lines and data which gives all sorts of nonsense that give the trader a conflicting story.
Pros:
- Uncanny accuracy in detecting reversals.
- Visually pleasing and easy to see market conditions.
- Can be used as a trend trading indicator or a counter-trend trading indicator.
- Strong back-testing results (~95% accuracy on Extreme signals).
Cons:
- Even with Overbought "Extreme" and Oversold "Extreme" conditions the indicator can sometimes cause you to trade in the reverse direction of a very strong trend causing large drawdowns before the price eventually reverses.
- Overbought "Extreme" and Oversold "Extreme" signals can be few and far between when trading on the 15-minute timeframe and higher. To counter this, it's recommended to trade at least 8 Major pairs to receive Extreme signals often.
How to use Chaos Reversals
A simple and winning system using Chaos can be made by marking Weekly and Daily Support and Resistance lines and counter-trend trading the approaching bounces off those support and resistance lines using the Overbought Extreme and Oversold Extreme signals of the 15-minute Chaos.
Signals are generated as follows:
- Fast W%R moves first, followed by slow W%R.
- When the single, fast W%R is Oversold or Overbought, you can scalp these reversals.
- When both fast and slow W%R are Oversold or Overbought, these show that the market is going to reverse by a significant amount.
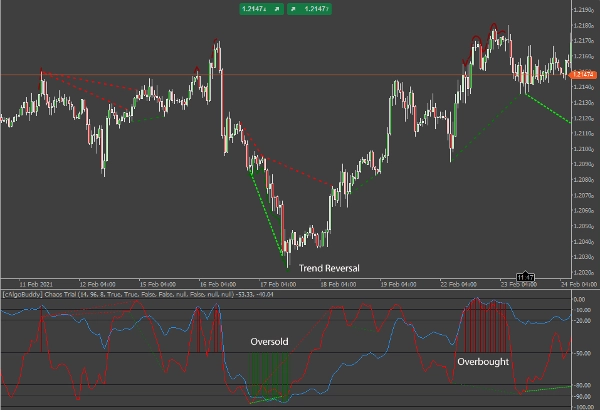
The indicator will draw a red or green line over the lows or highs on the price chart, as well as draw red or green lines in the indicator area to mark the extreme oversold or overbought conditions. You can disable this at the indicator’s options.
Spotting Divergences
Since W%R is an oscillator, it gives us the opportunity to spot and trade divergences. There are two primary types of Divergence: Regular and Hidden.
- Regular divergence is an indication of a reversal in price direction.
- Hidden divergence is an indication of a Continuation in price direction.
Within each primary type, there is a secondary classification: Bearish (Negative) and Bullish (Positive).
- A bearish divergence occurs when the indicator moves lower while the price either rises or flattens.
- A bullish divergence occurs when the indicator moves higher while the price either declines or flattens.
Regular Divergence
Regular Divergence in its simplest terms is when:
- Price is making higher Highs while the W%R fast line is making lower Highs: Potential Short.
- Price is making lower Lows while the W%R fast line is making higher Lows: potential Long.
In either case, a trader looks for a potential reversal in price action.
Regular divergence is best used as a comparison of the current Swing High or Swing Low to the previous current Swing High or Swing Low. With regular divergence, the trend is weakening and market sentiment has shifted in the opposite direction. Traders can prepare to trade a favourable reversal or retracement.
In the Chaos Reversals, regular divergence is shown as follows:
- Bullish Regular Divergence – Bright Green narrowly Dashed Line.
- Bearish Regular Divergence – Red narrowly Dashed Line
NOTE: Divergence Lines appear at the Open of the bar following a confirmed divergence.
Hidden Divergence
Hidden Divergence in its simplest terms is when:
- Fast W%R line is making lower Lows while the price is making higher Lows: a potential Long.
- Fast W%R line is making higher highs while the price is making lower Highs: a potential Short.
In either case, a trader looks for a potential continuation in price action.
Hidden divergence is best used to assess prices related to the prevailing trend. After a pullback, the price will often continue in the direction of the trend towards the level of the last Swing High or Swing Low. With hidden divergence, the trend may be weakening but it has not been completed yet. As shown below, the market pulled back probably due to profit-taking and looks to resume the downtrend.
In the Chaos Reversals, hidden divergence is shown as follows:
- Bearish Hidden Divergence – Green widely Dashed Line
- Bullish Hidden Divergence – Dark Red widely Dashed Line
Trading with Divergence
This is a quick note of caution when trading with Divergence. Be aware that the market may not move in the direction of a Divergence signal. It is important to understand that Divergence is an indication of a potential change or continuation in market direction. It is important to monitor the price movement to confirm market direction. Also, make note of the overall direction of the Chaos Indicator, by comparing the indicator lines to the levels (0 for extreme overbought, -100 for extreme oversold)
Alerts & Notifications
Signals that will be sent are Extreme Overbought/Oversold begin and end, slow W%R peak in extreme positions as well as all divergences.
Telegram Alerts
Given that you have a bot and a channel set up in Telegram, the Chaos Reversals indicator will send you messages for confirmed signals on the currency pair.
IMPORTANT:
Please make sure that your Time Zone is correctly adjusted to your local time (bottom right corner of the application).
Desktop Alerts
If you select Yes, the Chaos Reversals indicator will push a message box notification on confirmed signals on your personal desktop.
Email Alerts
For this functionality to work, you must first configure your cTrader to be able to send emails (Settings-> Email).
Summary
Customer reviews
5 | 100 % | |
4 | 0 % | |
3 | 0 % | |
2 | 0 % | |
1 | 0 % |


!["[Stellar Strategies] Market Session Ultimate" logo](https://cdn.ctrader.com/image/webp/61ffd537-0125-4246-9e72-42eca1791d64_28232)


