Brokers & props
For business
00
Days
:
00
Hours
:
00
Minutes
:
00
Seconds
Indicator
NAS100
Indices
Breakout
XAUUSD
ATR
Commodities
Forex
GBPUSD
Crypto
cAlgoBuddy - Boxify
07/01/2026
Desktop
Since 06/11/2024
Sales
9
"cAlgoBuddy - Boxify" uploaded image

The purpose of this cTrader algorithm of the Boxify indicator is to try to put price action into zones, or better, boxes. This way, the trader can get an edge on his trading positions. This is not an indicator that can stand on its own, but rather a nice tool that can complement any trading strategy or setup.


Detecting sideways movement can help the trader secure profits, cut losses or place limit orders in his favour. These are a few ways that we can use a box:


Detect consolidation areas

For past boxes that contain several bars inside them, we can safely assume that these are consolidation areas and that we have a sideways movement. These areas can serve as support or resistance levels in your analysis of the price action.


Place your trades better

In case you have a setup for a trade and you see the price boxing, you can always use the box as a guideline for the price action, to get a more beneficial position for your trade. The box that is currently forming can be used either to secure some profits in a winning position, re-enter a trending market or place stop losses.


Place limit orders

The long sideways movement will eventually lead to breakouts. Boxify can help you place limit orders, above or below, to get the most out of a breakout start.


Indicator options

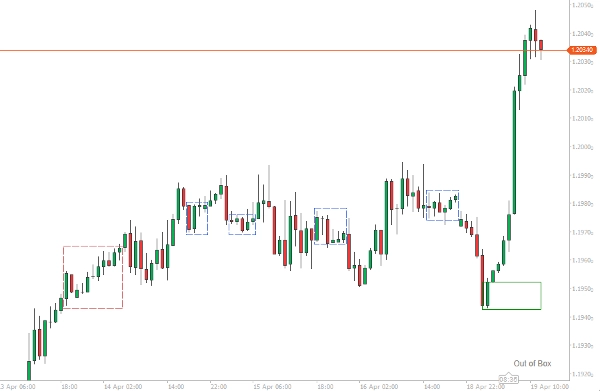
The indicator will attempt to box the price from at least 2 bars and above. Messages from the indicator will appear in the bottom right corner of the chart area.

  • If the price is trending, the message “Out of Box” will appear.
  • If the price is boxing, the message “Boxing” will appear.
  • If the price is boxing and the price breaks the upper limit, “Breaking High” will appear.
  • If the price is boxing and the price breaks the lower limit, “Breaking Low” will appear.

Boxes are considered complete at a new bar opening, as the price can always retract back into the box.


Minimum Bars for Box

This number represents the minimum number of bars that a box has to have to be considered complete. Use lower numbers for entry points, and higher numbers for consolidation areas.


ATR Filter

Boxify has internally an ATR indicator, that you can use as a filtering option, in case you want to stop the box formation on any bar that its length (High-Low) breaks the ATR value. Use this option if you want to enter trades.


Merge Overlaps

The beginning of a box can start before the previous box has ended (especially if we have selected a very low number for box length). We can merge these boxes with this option, so we can see a bigger box forming – These boxes will have a blue-coloured border.


Tolerance

A number that reflects the tolerance that the top/bottom limits of the boxes can have. Small numbers should be used when we want to enter trades, bigger numbers should be used when we want to find consolidation areas.

0.0
Reviews: 0
Customer reviews
No reviews for this product yet. Already tried it? Be the first to tell others!
More from this author
Indicator
Indices
XAUUSD
Stocks
+5
cAlgoBuddy - Ultimate Candlestick Patterns
The ultimate candlestick suite is here to help you detect most of the candlestick patters that exist today.
Indicator
NAS100
Indices
RSI
+9
cAlgoBuddy - TDI Pro
All in One indicator designed to reveal Market Sentiment.
Indicator
Indices
XAUUSD
Commodities
+5
cAlgoBuddy - Chaos Reversals
The cTrader Chaos Reversals indicator brings high-quality reversal signals to traders.
Indicator
XAUUSD
Martingale
Commodities
+2
cAlgoBuddy - Zone Recovery
The Zone Recovery indicator is used in an advanced hedging strategy, opening traders in the opposite direction.
Indicator
Indices
XAUUSD
Breakout
+5
cAlgoBuddy - ADX Divergences
This cTrader ADX Divergence indicator is used to quantify trend strength divergences in a very profitable way.
Indicator
Indices
RSI
XAUUSD
+5
cAlgoBuddy - Composite Index RSI
What Constance Brown did with the RSI was to input a momentum calculation within the RSI itself. This the Composite RSI.
You may also like
Indicator
NAS100
NZDUSD
XAUUSD
+10
Candle Count
Label each candle sequentially with flexible session resets.
Indicator
Indices
Prop
Forex
+1
Vision - Advanced Session Indicator
Indicator
NAS100
NZDUSD
Breakout
+14
Matrix Pro by PrimeQuant
Multi-timeframe S/R, SRWMA trend & Demarker pivots with smart alerts—clarity for any market, any timeframe.
Indicator
Signal
ORB_Dashboard
Trades Opening Range Breakouts Indicator with dynamic stops/targets adapting to market volatility.
Indicator
Grid
NAS100
NZDUSD
+15
SystemAlgo1
Institutional Supply & Demand Mapping Across Five Timeframes — Automatically.
Indicator
Grid
XAUUSD
Commodities
+5
Trend Scope pro
Trend Scope Pro – Smarter Trend Analysis with Linear Regression Channels
Indicator
NAS100
NZDUSD
Martingale
+26
MMXM Structure by Ludwig
MMXM Structure by LudwigICT – Professional Market Structure Mapping Tool
Indicator
RSI
Breakout
XAUUSD
+5
Auto-Trend Channel
Adaptive trend channel using linear regression and Pearson correlation for dynamic support, resistance, and trends.
Indicator
RSI
MACD
sarah trend
Un indicateur tout-en-un intelligent qui détecte la tendance, donne un avis clair (achat/vente)
Indicator
Indices
Stocks
Forex
+2
HorizontalSupportResistance
This extraordinary multi-timeframe support and resistance indicator is nothing short of market wizardry.
Indicator
Indices
Stocks
Commodities
+2
SymbolTFOverlay
The SymbolTFOverlay display the current symbol and timeframe as a semi-transparent text overlay on the chart.
Market Polarity Zones
implifies market analysis by automatically identifying bullish 🚀 or bearish 🐻 phases and marking key levels where ....
Indicator
NAS100
NZDUSD
Breakout
+6
support and resistance
Support and Resistance Line Indicator with Higher Timeframe Filter
Indicator
Grid
RSI
XAUUSD
+14
Trend Entropy pro
Entropy is the scientific measure of disorder or uncertainty in a system
Indicator
Signal
Hammer Pattern Indicator
ZigZagSmartAlert_demo
ZigZag Smart Alert DEMO for cTrader DEMO VERSION 24 hours free trial! This is a DEMO version of the ZigZag Smart Aler
Daily Sessions HighLow Helper
Shows daily and sessions highs / lows and session boxes, everything configurable
zh-cn Variety Period time panel(multilanguage)
This indicator can be used to: change color, shape size, position, change font, increase or decrease, and other function