
Description
⚡ Key Features
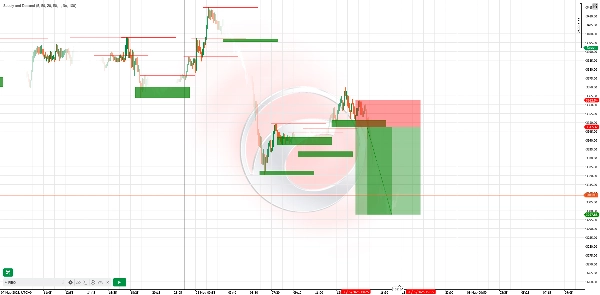
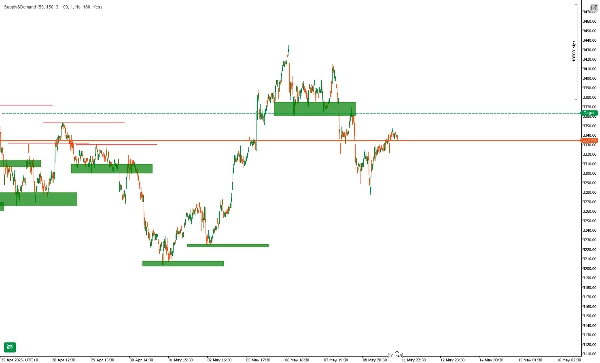
- Dynamic Zone Detection
- Auto‑detects swing highs/lows and draws supply (resistance) & demand (support) zones in real time.
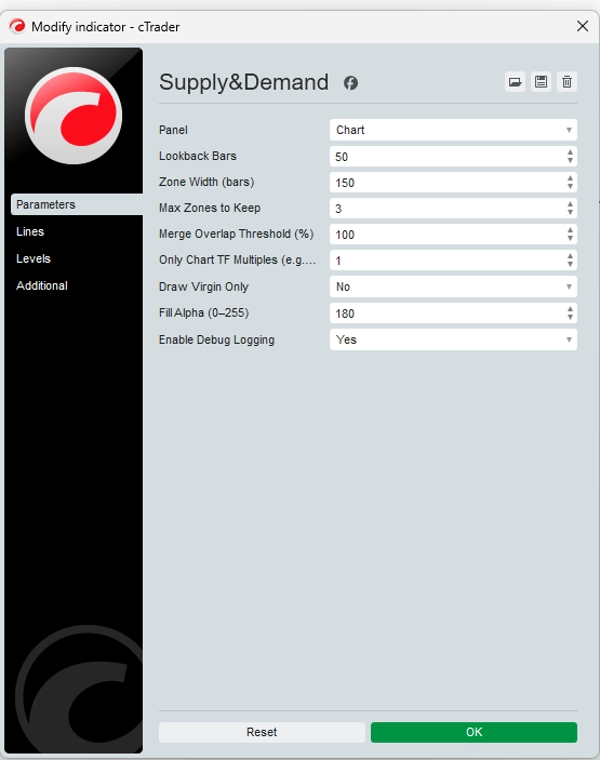
- Configurable lookback & zone‑width parameters let you adapt sensitivity for any market or timeframe.
- Virgin‑Zone Highlighting
- Fresh “virgin” zones (never‑touched by price) are visually emphasized—trade where institutions left orders.
- Optionally hide touched zones to keep your chart uncluttered.
- Multi‑Timeframe Filtering
- Plot only zones that align with your chart’s timeframe multiple (e.g. show daily zones on your 1‑hour chart).
- Quickly see the confluence of higher‑TF supply/demand with your intraday setup.
- Non‑Repainting & Non‑Lagging
- Zones are fixed once drawn—no disappearing or shifting lines after price moves.
- Back‑tested reliability: zones remain static, giving you confidence in historical analysis.
- Custom Alerts & Logging
- Get pop‑up or email alerts when price enters or breaks a zone.
- Detailed debug log shows zone creation, overlaps skipped, and zone touches.
🚀 How It Works
- Pivot Detection: The indicator scans each new bar for pivot highs (supply) and pivot lows (demand) based on your chosen lookback.
- Zone Construction: For each pivot, a rectangular zone is drawn extending forward—highlighting where institutions likely placed limit orders.
- Overlap Filtering: Zones overlapping beyond your threshold merge or skip, ensuring only the most significant areas remain.
- Virgin‑Only Option: Keep only untouched zones visible to focus on the freshest institutional levels.
🎯 Example Trading Strategies
StrategyTimeframeEntryStop‑LossTake‑Profit
Zone Rejection
H1
Wait for price to rally into a demand zone and show a bearish candlestick (engulfing/pin bar) in supply zone
Just beyond zone boundary
1.5× zone height
TF Confluence
M15 + H4
Identify H4 demand zone, then switch to M15 for bullish momentum candle inside that zone
Below H4 zone low
Next H4 swing high
Break & Retest
H4
After price breaks a supply zone, wait for retest of zone underside and bearish confirmation
Above zone top
Recent H4 low
Usage Tip: Combine with RSI or MACD divergence inside zones for higher‑probability signals.
📈 Real‑World Example
- On EURUSD H4, the indicator draws a demand zone at 1.0950–1.0980.
- Price dips into zone, prints an M15 bullish engulfing candle.
- Entry at 1.0970, stop at 1.0945 (below zone), target at 1.1040 (next H4 resistance).
- Result: +70 pips (~6.4× risk).
⚠️ Disclaimer
This indicator is a tool—not a guaranteed profit system. Past performance does not ensure future results. Always use proper risk management (e.g. max 2% per trade), test on a demo account first, and combine with your own analysis. Trading carries risk of loss; only trade with capital you can afford to lose.
Summary
It supports multi-timeframe filtering, allowing users to display zones aligned with higher timeframe multiples on lower timeframe charts, facilitating confluence analysis. Zones are non-repainting and non-lagging; once drawn, they remain fixed, ensuring reliable historical analysis. Custom alerts notify users when price enters or breaks these zones, and detailed logs track zone creation and interactions.
The indicator operates by scanning each new bar for pivot highs and lows, constructing rectangular zones extending forward, and filtering overlapping zones to retain the most significant areas. It offers a “virgin-only” mode to focus on fresh institutional levels.
Example strategies include zone rejection, multi-timeframe confluence, and break & retest setups, often combined with RSI or MACD divergence for higher-probability signals. A real-world example on EURUSD H4 demonstrates entry, stop-loss, and take-profit placement based on demand zones and candlestick confirmation.
Customer reviews
5 | 75 % | |
4 | 25 % | |
3 | 0 % | |
2 | 0 % | |
1 | 0 % |


