
Description
ICT Killzones Complete – Professional Trading Session Analysis
Master institutional trading timing with the most comprehensive ICT Killzones indicator for cTrader. This professional-grade tool automatically identifies and visualizes all five critical ICT (Inner Circle Trader) trading sessions, giving you the edge to trade alongside smart money.
What's New in This Version:
- All 5 ICT Sessions: Complete coverage including Asian Range, London Kill Zone, New York Kill Zone, NY Lunch/Reversal Zone, and NY PM Kill Zone
- Smart Color System: Simple color names (Red, Blue, Orange) instead of complex ARGB codes
- Independent Transparency Controls: Adjust opacity for each session (0-100%)
- Session-Specific Label Colors: Customize label colors independently from zone colors
- Session Descriptions: Optional info labels explaining each session's characteristics
- Enhanced Performance: Optimized code with automatic cleanup of old zones
Key Features:
📊 Complete Session Coverage:
- Asian Range (19:00-00:00 NY): Identifies consolidation zones and liquidity pools for later raids
- London Kill Zone (02:00-05:00 NY): Marks major volatility spikes ideal for stop hunts and reversals
- NY Kill Zone (07:00-10:00 NY): Highlights the second major move with strong momentum
- NY Lunch Zone (12:00-13:30 NY): Shows reversal and consolidation periods
- NY PM Kill Zone (13:30-16:00 NY): Captures secondary moves and market rebalancing
🎨 Easy Color Customization:
- Simple color names: just type "Blue", "Orange", "Purple", etc.
- 50+ predefined colors including DodgerBlue, BlueViolet, MediumAquamarine
- Hex color support (#RRGGBB format)
- Individual transparency sliders (0-100%) for each zone
- Separate label colors for maximum clarity
⚙️ Powerful Display Options:
- Toggle individual sessions on/off
- Show/hide session information labels
- Adjustable font size (6-20)
- Extend zones to chart edge or keep them contained
- Control how many days of history to display (1-30 days)
- Automatic cleanup prevents chart clutter
🎯 Professional Design:
- Clean, non-intrusive visualization
- Dynamic high/low tracking during active sessions
- Proper handling of overnight sessions
- Works on all timeframes
- Zero lag, optimized performance
Ideal For:
- ICT methodology traders seeking precision timing
- Smart money traders following institutional flows
- Day traders and scalpers requiring exact session boundaries
- Swing traders identifying key reversal zones
- Anyone looking to align trades with major market sessions
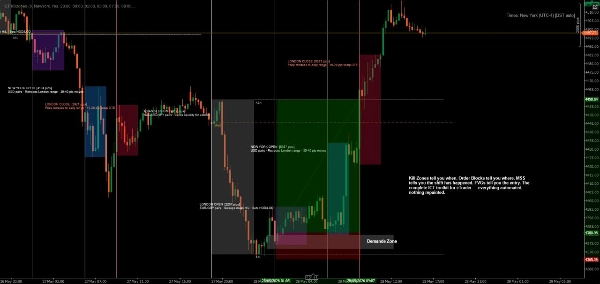
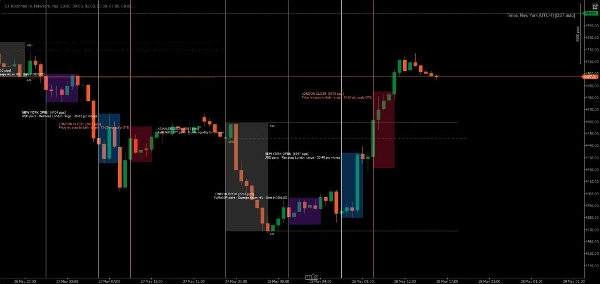
How It Works:
The indicator automatically detects each trading day and creates color-coded zones for all five ICT sessions. As price moves through each session, the indicator tracks the high and low, then draws the final zone when the session closes. Labels clearly identify each session and optionally display its trading characteristics.
All times are in New York (Eastern) time, following standard ICT methodology.
Customization Examples:
- Conservative Setup: Low transparency (20-30%), subtle colors, no session info
- Bold Setup: High transparency (70-80%), vibrant colors, full session descriptions
- Minimal Setup: Turn off unwanted sessions, keep only your preferred killzones
- Color-Coded Strategy: Match zone colors to your trading bias (green = long, red = short)
System Requirements:
- Platform: cTrader Desktop (cTrader Store products are not supported on Web or Mobile versions) blog.ctrader.com
- Operating System: Windows 7 or higher
- Processor: Dual-core CPU recommended
- Memory: 2 GB RAM minimum (4 GB recommended)
- Internet Connection: 50 kB per second or faster
Installation Instructions:
- Purchase/Install: Obtain the indicator from the cTrader Store
- Download cTrader Desktop: If not already installed, download from ctrader.com
- Log In: Open cTrader Desktop and sign in with your cTrader ID
- Access the Indicator: Navigate to the "Algo" section → "Indicators" list
- Add to Chart: Right-click any chart → "Indicators" → Select "ICT Killzones Complete"
- Customize: Right-click the indicator name on the chart → "Settings" to adjust colors, times, and display options
Tips for Best Results:
- Use on 1-minute to 1-hour timeframes for optimal visibility
- Combine with price action and liquidity concepts for best results
- Adjust session times if your broker uses different time zones
- Experiment with transparency to find your perfect visual balance
- Enable session info labels when learning, disable for cleaner charts
Trade with precision. Trade with confidence. Trade the ICT way.
Note: This indicator is for educational and informational purposes. Past performance does not guarantee future results. Always practice proper risk management.
Summary
The indicator tracks high and low prices during active sessions and finalizes zones upon session close, providing clear visual boundaries for institutional trading timing. It supports all timeframes, handles overnight sessions properly, and includes automatic cleanup of old zones to maintain chart clarity. Customization options include font size adjustment, zone extension control, and history length for displayed zones. ICT Killzones Complete is suitable for traders using ICT methodology, smart money concepts, scalping, day trading, and swing trading across markets such as Forex, commodities, and crypto. It requires cTrader Desktop on Windows 7 or higher with recommended hardware specifications.
Customer reviews
5 | 50 % | |
4 | 25 % | |
3 | 0 % | |
2 | 25 % | |
1 | 0 % |


