
ProVWAP
Indicator
7 purchases
Version 1.0, May 2025
Windows, Mac
4.5
Reviews: 2
Description
ProVWAP – Your Anchored VWAP & Volatility Bands for cTrader
Take control of your trades with ProVWAP, the ultimate VWAP toolkit designed for all trading styles.
🔧 Key Features
Summary
AI summary
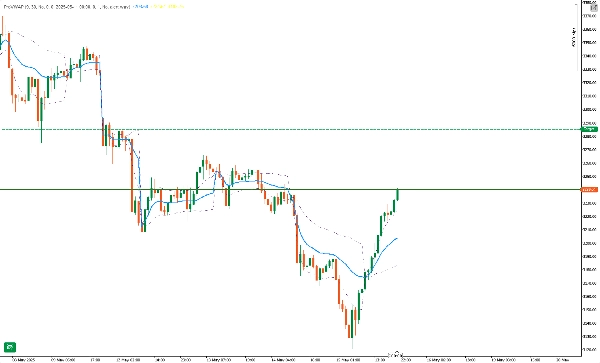
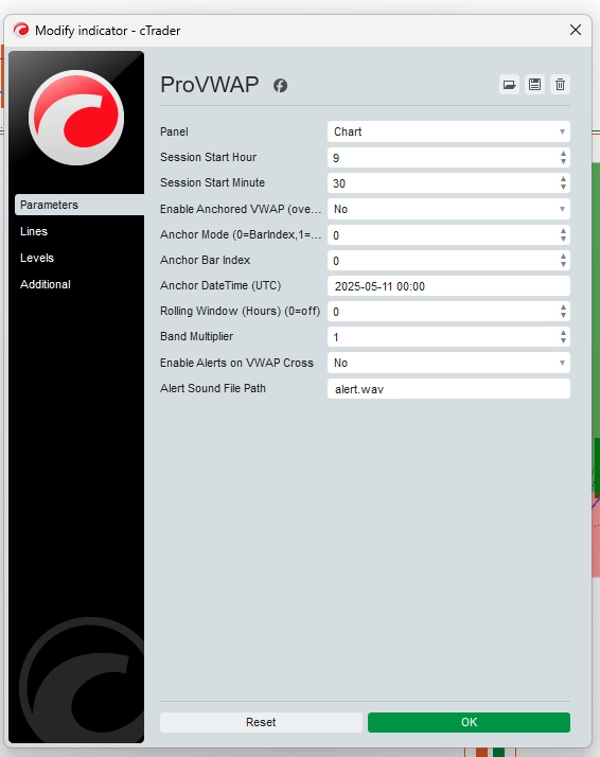
ProVWAP is an advanced indicator for the cTrader platform that provides anchored Volume Weighted Average Price (VWAP) analysis combined with volatility bands. It allows traders to anchor the VWAP at any specific candle index or exact date/time, enabling precise tracking of price action from pivotal points. The indicator supports customizable session resets, automatically restarting VWAP calculations at user-defined times to align with trading sessions.
Key features include a rolling window VWAP calculation over recent hours to capture dynamic trends, and volatility bands based on standard deviation to assess price strength and potential breakout zones. ProVWAP offers smart visual and audible alerts when price crosses the anchored VWAP, aiding timely decision-making. Its clean, non-intrusive overlay works across all timeframes.
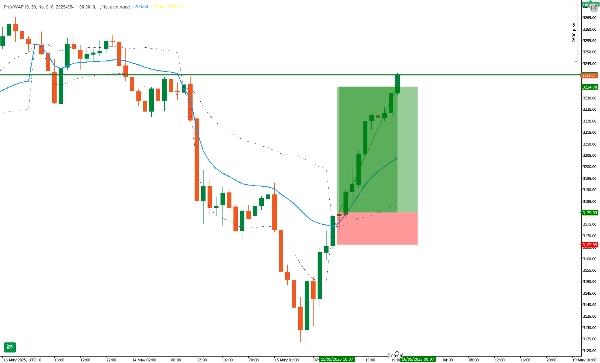
The tool is designed to reveal institutional fair-value zones, offering flexibility to tailor anchoring and analysis windows to individual strategies. It supports early-warning signals for breakouts and reversals. A sample strategy for Gold (XAU/USD) on a 1-hour timeframe demonstrates usage with session resets, band multipliers, and entry/exit rules based on price action relative to bands and RSI.
ProVWAP includes position management features such as stop-loss placement near the anchored VWAP, take-profit targets at risk-reward ratios or band touches, and trailing stops based on ATR. The license is tied to a cTrader account and includes lifetime updates and dedicated support.
Key features include a rolling window VWAP calculation over recent hours to capture dynamic trends, and volatility bands based on standard deviation to assess price strength and potential breakout zones. ProVWAP offers smart visual and audible alerts when price crosses the anchored VWAP, aiding timely decision-making. Its clean, non-intrusive overlay works across all timeframes.
The tool is designed to reveal institutional fair-value zones, offering flexibility to tailor anchoring and analysis windows to individual strategies. It supports early-warning signals for breakouts and reversals. A sample strategy for Gold (XAU/USD) on a 1-hour timeframe demonstrates usage with session resets, band multipliers, and entry/exit rules based on price action relative to bands and RSI.
ProVWAP includes position management features such as stop-loss placement near the anchored VWAP, take-profit targets at risk-reward ratios or band touches, and trailing stops based on ATR. The license is tied to a cTrader account and includes lifetime updates and dedicated support.
Indicator profile
Customer reviews
4.5
Reviews: 2
5 | 50 % | |
4 | 50 % | |
3 | 0 % | |
2 | 0 % | |
1 | 0 % |
Customer reviews
November 9, 2025
ProVWAP keeps your trades grounded ⚖️ - a clean, flexible VWAP tool with multi-session support and smooth performance. Perfect for spotting fair-value zones and intraday bounces. Add deviation bands and alerts, and it’d be near perfect for volume-based strategy lovers.
May 29, 2025
Discussion
FAQ
Breakout
Indices
Commodities
RSI
XAUUSD
ATR
VWAP
Products available through cTrader Store, including trading bots, indicators and plugins, are provided by third-party developers and made available for informational and technical access purposes only. cTrader Store is not a broker and does not provide investment advice, personal recommendations or any guarantee of future performance.


Price
Since 22/11/2024
140
Sales
2.61K
Free installs