Brokers & props
For business
00
Days
:
00
Hours
:
00
Minutes
:
00
Seconds
Indicator
NAS100
XAUUSD
Forex
Signal
Crypto
BTCUSD
Multiple Non-Linear Regression
12/12/2025
Desktop
Since 27/11/2025
Sales
4
Free installs
520
"Multiple Non-Linear Regression" uploaded image"Multiple Non-Linear Regression" uploaded image"Multiple Non-Linear Regression" uploaded image"Multiple Non-Linear Regression" uploaded image"Multiple Non-Linear Regression" uploaded image

This indicator is designed to perform multiple non-linear regression analysis using four independent variables: close, open, high, and low prices.

Here's a components and functionalities:
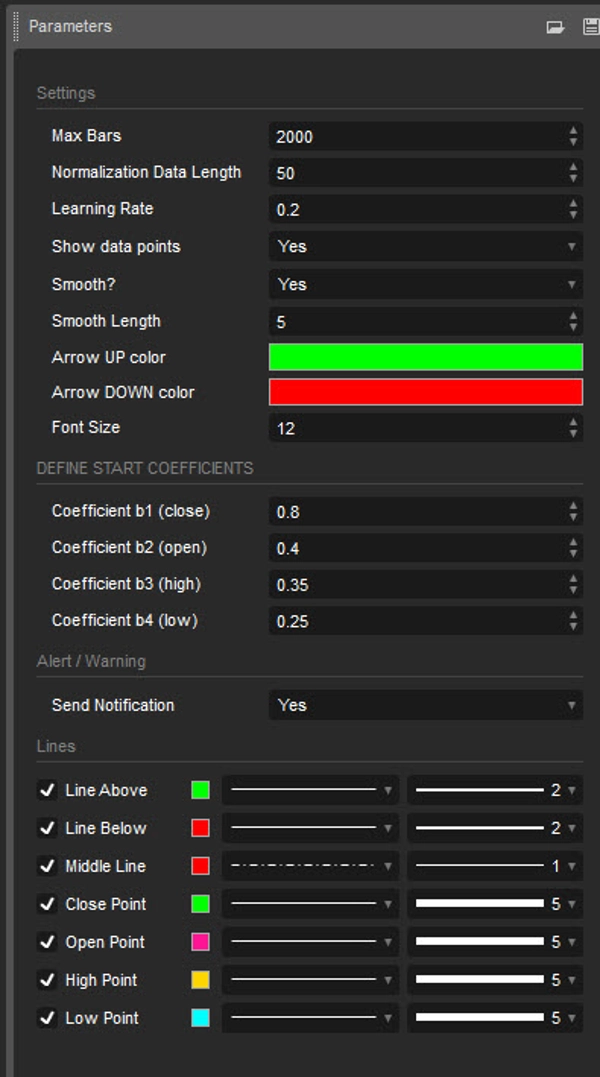
Inputs:

  • Normalization Data Length: Length of data used for normalization.
  • Learning Rate: Rate at which the algorithm learns from errors.
  • Show data points: Show plotting of normalized input data(close, open, high, low)
  • Smooth?: Option to smooth the output.
  • Smooth Length: Length of smoothing if enabled.
  • Define start coefficients: Initial coefficients for the regression equation.

Data Normalization:

The script normalizes input data to a range between 0 and 1 using the highest and lowest values within a specified length.

Non-linear Regression:

It calculates the regression equation using the input coefficients and normalized data. The equation used is a weighted sum of the independent variables, with coefficients adjusted iteratively using gradient descent to minimize errors.

Error Calculation:

The script computes the error between the actual and predicted values.

Gradient Descent:

The coefficients are updated iteratively using gradient descent to minimize the error.

Visualization:

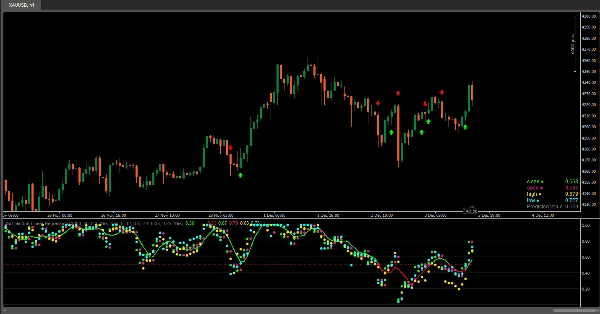
  • Plotting of normalized input data (close, open, high, low).
  • The indicator provides visualization of normalized data values (close, open, high, low) in the form of circular markers on the chart, allowing users to easily observe the relative positions of these values in relation to each other and the regression line.
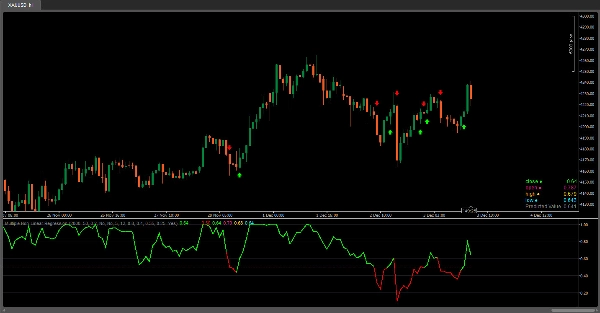
  • Plotting of the regression line.
  • Color gradient on the regression line based on its value and bar colors.
  • Display of normalized input data and predicted value in a table.
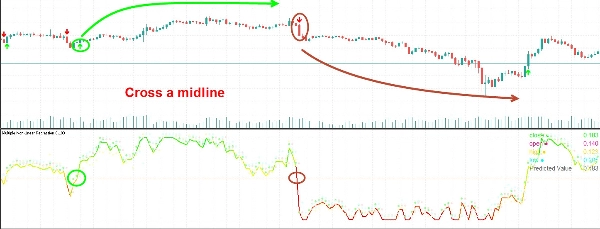
  • Signals for crossovers with a midline (0.5).
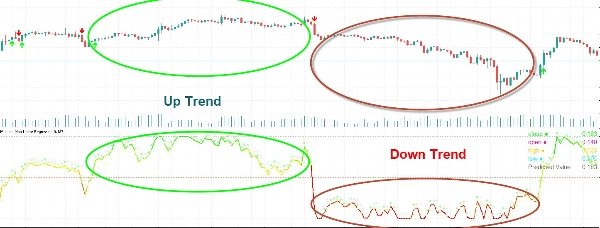
Interpretation:

Users can interpret the regression line and its crossovers with the midline (0.5) as signals for potential buy or sell opportunities.

This indicator helps users analyze the relationship between multiple variables and make trading decisions based on the regression analysis. Adjusting the coefficients and parameters can fine-tune the model's performance according to specific market conditions.

0.0
Reviews: 0
Customer reviews
No reviews for this product yet. Already tried it? Be the first to tell others!
More from this author
Indicator
NAS100
XAUUSD
FVG
+6
Fair Value Gaps
The Fair Value Gap (FVG) Indicator identifies inefficiencies in price action where an imbalance occurs due to aggressive
Indicator
NAS100
XAUUSD
FVG
+6
Simple Smart Money Concepts
Simple Smart Money Concepts (SMC)
Indicator
NAS100
XAUUSD
Forex
+5
Market Sessions Pre
The Market Sessions indicator is a popular tool for visually representing global trading sessions on a price chart.
Indicator
NAS100
XAUUSD
Forex
+3
Linear Regression Oscillator
The Linear Regression Oscillator (LRO) is a technical indicator based on linear regression analysis.
Indicator
NAS100
XAUUSD
Forex
+4
MACD Indicator NDH
MACD Indicator with Histogram that plots Colors Based on Direction Above and Below the Zero Line.
Indicator
NAS100
XAUUSD
Forex
+4
Pure Price Action ICT Tools
Indicator
NAS100
XAUUSD
Stocks
+4
Orderblock Detector
This indicator displays the OrderBlocks of the current and higher timeframe, made by ICT's student.
Indicator
NAS100
XAUUSD
FVG
+5
Fair Value Gaps with Order Block Detector
All-In-One solution for ICT's FVG IFVG ORDERBLOCK in advanced mode.
Indicator
NAS100
XAUUSD
FVG
+4
Simple ICT Concepts
Simple ICT Concepts
You may also like
smma tel
Wstęgi HTS 33 144 mobile
Alert Positioner
Auto Fill Alert on all Ur Markings. **Easy to mark on multiple devices using Alerts' Position
Forex Market Color
A single color for each session.
Indicator
NAS100
Indices
XAUUSD
+4
BSL_SSL_Liqudity
Buy-Side & Sell-Side Liquidity (BSL/SSL) Indicator
Indicator
Indices
Prop
Stocks
+3
4MA
This indicator consists of 3 moving averages that can be configured to your liking, from the type of moving average....
Indicator
NAS100
NZDUSD
Breakout
+12
rolling stdv
Multi-Timeframe Rolling Volatility Indicator - Smart Volatility Breakout System
Indicator
Indices
Prop
Stocks
+3
Levels
Price Action Zone shows previous D/W/M key levels to help frame intraday price action, liquidity, and market structure.
Indicator
Indices
Stocks
Commodities
+2
Volume Spread Analysis
VSA indicator analyzing volume, spread, and close location to detect supply/demand imbalances.
Indicator
NAS100
NZDUSD
XAUUSD
+13
SupportResistance
Auto-detect support and resistance & trendlines, highlight pullbacks/BOS retests, and filter with candle confirmation.
Indicator
NAS100
Indices
NZDUSD
+9
Volumatic Fair Value Gaps
📊 Detects Fair Value Gaps with lower timeframe volume analysis & clean dashboard 🟢🔴
ScalperSignalVisual
Overview of the Fade Breakout Visualizer Indicator
Indicator
NAS100
RSI
NZDUSD
+21
QX LiquiditySweep
Liquidity sweeps without clutter. Equal highs/lows pools, sweeps + reclaim, filters + compact panel. StepSize-based.
zh-cn Variety Period time panel(multilanguage)
This indicator can be used to: change color, shape size, position, change font, increase or decrease, and other function
Reversal Probability Engine
Detecting reversal zones + multidimensional mapping of support and resistance "Golden Levels.
Indicator
NAS100
NZDUSD
Martingale
+25
Volume Profile Suite trial7D
DEMO VERSION 7 DAYS VolumeProfileSuite is an advanced and flexible Volume Profile indicator for cTrader.
Indicator
Stocks
Forex
Crypto
+1
Market Structure SNR + Auto Bias
Market Structure Indicator – Your Trading Map in a Noisy Market. No more Panicking Which one, Where, Why and How.
Indicator
NAS100
NZDUSD
XAUUSD
+12
FVG_Bruno
Fair Value Gap (FVG) indicator identifies price inefficiencies in the market by highlighting gaps between candlesticks.
Drawing Utility
A rectangular box with 5 adjustable Fibonacci level or even custom ones.