"Trend Duration Forecast" logo
Indicator
Version 1.0, May 2026
Windows, Mac
"Trend Duration Forecast" uploaded image
32
Sales
2.08K
Free installs

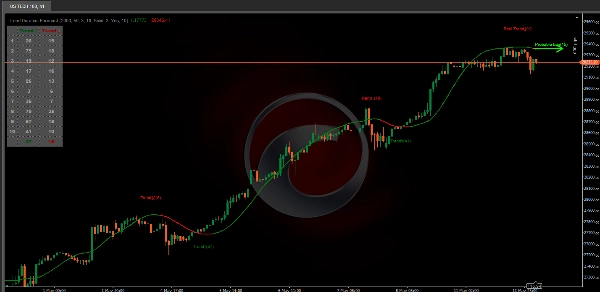
The Trend Duration Forecast indicator is designed to estimate the probable lifespan of a bullish or bearish trend. Using a Hull Moving Average (HMA) to detect directional shifts, it tracks the duration of each historical trend and calculates an average to forecast how long the current trend is statistically likely to continue. This allows traders to visualize both real-time trend strength and potential exhaustion zones with exceptional clarity.

KEY FEATURES

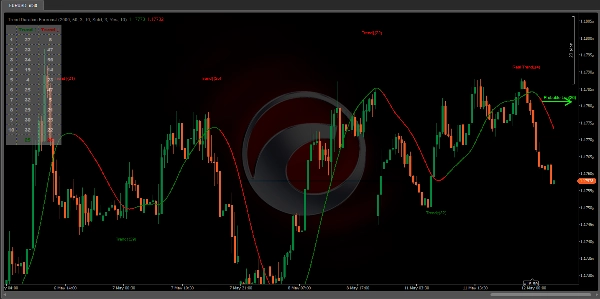
Dynamic Trend Detection: Utilizes the Hull Moving Average to identify when price transitions into a new uptrend or downtrend.

Trend Duration Counting: Measures the number of bars in each completed bullish and bearish phase to understand trend persistence.

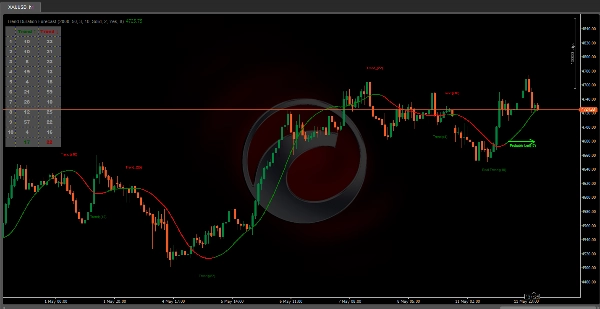
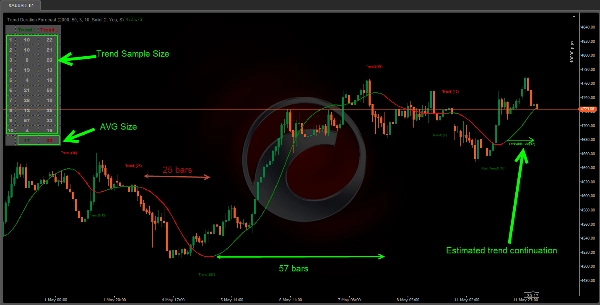
Forecast Projection: Automatically projects an estimated trend continuation line based on the average length of recent trends.

Real-Time Updates: Continuously updates the “Real Length” label as the trend develops

Historical Data Table: Displays previous trend durations for both bullish and bearish cycles, along with their averages.

Adaptive Sampling: Uses a customizable sample size to smooth out volatility in the forecast and provide statistically meaningful projections.

Color-Based Clarity: Highlights uptrends is green and downtrends is red for instant visual interpretation.


Compare the Real Length of the ongoing trend with the Probable Length forecast to estimate whether the move is nearing exhaustion.

Ideal for swing or trend-following strategies where trend longevity is crucial to managing entries and exits effectively.
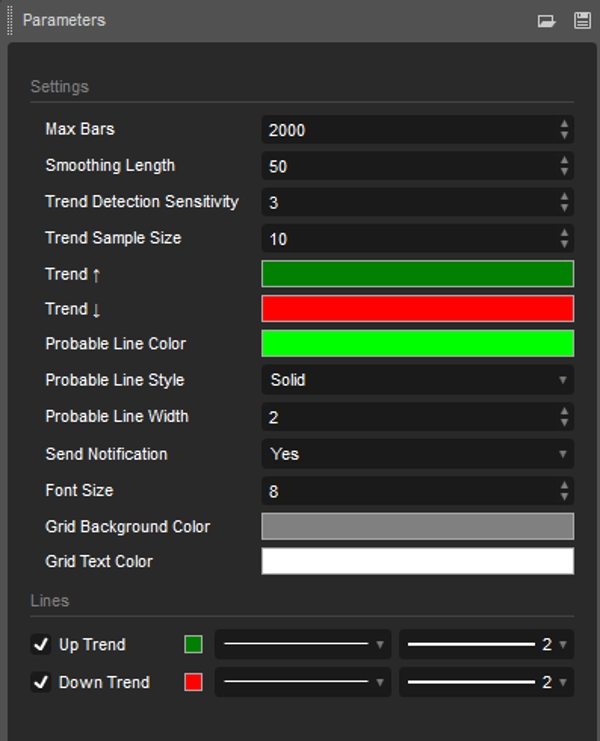
SETTINGS

Trend Detection Sensitivity: Control how fast or slow the indicator reacts to trend changes — lower values increase responsiveness, while higher values smooth out noise.

Trend Sample Size: Historical duration table to understand the average lifespan of trends in the current market structure

Color Trend: Use the color HMA line and projection arrows to identify when momentum strength is fading and prepare for possible reversals.

Alert: Alert when the trend reverses.

The Trend Duration Forecast gives traders a quantitative edge by combining real-time trend tracking with statistical forecasting. It helps identify not only when a new trend begins, but also how long it’s likely to persist based on past market behavior. This indicator enhances timing precision for both entries and exits, supporting smarter trend-following decisions with clear, data-driven insights.

Indicator profile
Indicator category
Trend
Output type
Visualisation
Data requirements
Bars only
Supported signals
Trend strength
Volatility
0.0
Reviews: 0
Customer reviews
No reviews for this product yet. Already tried it? Be the first to tell others!
EMA
SMA
Flag
Market Structure
Channel
ATR
Moving Average
Products available through cTrader Store, including trading bots, indicators and plugins, are provided by third-party developers and made available for informational and technical access purposes only. cTrader Store is not a broker and does not provide investment advice, personal recommendations or any guarantee of future performance.

More from this author

Indicator
SMC
Forex
+7
The Fair Value Gap (FVG) Indicator identifies inefficiencies in price action where an imbalance occurs due to aggressive
Indicator
SMC
Forex
+7
Simple Smart Money Concepts (SMC)
Indicator
Forex
BTCUSD
+6
The Market Sessions indicator is a popular tool for visually representing global trading sessions on a price chart.
Indicator
SMC
Forex
+5
Pure Price Action ICT Tools
Indicator
MACD
Forex
+5
MACD Indicator with Histogram that plots Colors Based on Direction Above and Below the Zero Line.
Indicator
Forex
BTCUSD
+6
All-In-One solution for ICT's FVG IFVG ORDERBLOCK in advanced mode.
Indicator
Forex
BTCUSD
+4
The Linear Regression Oscillator (LRO) is a technical indicator based on linear regression analysis.
Indicator
Forex
BTCUSD
+5
Simple ICT Concepts
Indicator
Forex
BTCUSD
+5
This indicator displays the OrderBlocks of the current and higher timeframe, made by ICT's student.
Indicator
Forex
BTCUSD
+4
This indicator is designed to perform multiple non-linear regression analysis using four independent variables.
Indicator
ATR
EMA
+4
Trendlines Oscillator
Indicator
ATR
EMA
+3
Super Trend Targets

You may also like

Indicator
Forex
Real-Time Candlestick Pattern Detection with Custom Alerts & Trend Analysis for cTrader
Indicator
IVB 2.0 is an indicator that works on the strategy of imbalance of the maximum volatility box of indices
Indicator
Key Levels
Supply & Demand
+2
Institutional Levels Pro is an essential tool for traders who rely on price action and institutional market structure.
Indicator
ZigZag
Indices
+2
Auto Trendlines, Fibonacci, Pitchfork and Patterns from non‑repainting pivots. One‑click Presets, targeted Alerts, and a
Indicator
Prop
Forex
+11
Customize your Moving Average! Choose any timeframe and price source for precision and flexibility in your analysis.
Indicator
Forex
Customizable Dynamic Fibonacci Channels and Smart Alerts
Indicator
CandleCounterAlex – Candle Cycle Counter with Colors and Adjustable Position.
Indicator
Auto-detect supply & demand zones, remove broken levels, and trade smarter with real-time alerts. Precision made simple.
Indicator
Prop
Forex
+15
The best filter for trading trend continuations on Renko charts.
Indicator
Prop
Forex
+4
Displays real-time balance, equity, P&L, margin metrics directly on your charts.
Indicator
Imbalance
AI-assisted
+4
Predict continuity or rejection on range bars. Plots a precise visual box to anticipate candle close price levels.
Indicator
Prop
Forex
+13
Color Volume Bars – Visualize Market Strength Instantly
Indicator
ATR
Market Structure
+3
Support Resistance Toolkit
Indicator
EMA
Supertrend
+4
Dynamic dual MA cloud indicator. Identifies trends, crossovers, and pullback entries in real time for any asset.
Indicator
MSS
Market Structure
NY HTF Candles is a precision panel designed specifically for institutional traders
Indicator
SMC
Prop
+8
KILLZONES AND MACRO SESSIONS
Indicator
ATR
RSI
+5
Delta RSI Candle Pro, the indicator that transforms ordinary candlesticks into powerful momentum visualizers.
Indicator
ATR
Forex
+5
Most used candle patterns. (1 candle, 2 candles and 3 candles patterns) and Marubozu. Bonus Fibo Risk control.
32
Sales
2.08K
Free installs