
Descrizione
Blocco di rottura CHoCH
https://chartshots.spotware.com/c/69960085a796e
Questo indicatore è progettato per i trader che operano con Price Action e Smart Money Concepts (SMC) metodologie. Uso consigliato:
- 🔍 Identificare il CHoCH come primo segnale di una possibile inversione strutturale.
- 👀 Osservare la zona di interesse generata: è l'area dove il prezzo solitamente ritorna prima di continuare nella nuova direzione.
- ⏳ Attendere che il prezzo torni nella zona e, al suo interno, cercare la congiunzione con livelli di Fibonacci (specialmente 0.382, 0.5, 0.618 e 0.786).
- ✅ Confermare con una candela engulfing (se in modalità StructureBased) all'interno della zona per un ingresso più preciso.
- ❌ Il trade è invalidato se il prezzo viola il confine opposto della zona, poiché l'indicatore stesso annulla la zona in quel momento.
https://chartshots.spotware.com/c/699600271b05d
📊 1. Analisi della struttura a tre livelli
L'indicatore analizza il mercato attraverso tre livelli gerarchici annidati, dal meno al più significativo:
- 🔹 Breve termine: Rileva i massimi e minimi locali più recenti confrontando tre candele consecutive. Un minimo locale è confermato quando la candela centrale è più bassa sia della precedente che della successiva. Un massimo locale funziona al contrario.
- 🔸 Termine intermedio: Costruito sopra i punti a breve termine. Quando gli swing a breve termine formano un modello di minimi più bassi o massimi più alti (cioè tre swing successivi confermano una direzione), viene stabilito un punto a termine intermedio.
- 🔺 Lungo termine: Costruito esattamente allo stesso modo ma usando i punti a termine intermedio come base. Questo è il livello più significativo e quello che attiva gli eventi principali dell'indicatore.
💡 Questa struttura a cascata garantisce che solo i movimenti con reale peso strutturale generino segnali, filtrando il rumore a breve termine.
🔄 2. CHoCH — Cambio di carattere
Il CHoCH è l'evento centrale dell'indicatore. Si verifica quando:
- 🟢 CHoCH rialzista: Il prezzo chiude sopra un precedente massimo strutturale a lungo termine, mentre la direzione di mercato precedente era ribassista. Questo indica che i venditori hanno perso il controllo e il mercato potrebbe invertire verso l'alto.
- 🔴 CHoCH ribassista: Il prezzo chiude sotto un precedente minimo strutturale a lungo termine, mentre la direzione precedente era rialzista. Questo indica che gli acquirenti hanno perso il controllo e il mercato potrebbe invertire verso il basso.
Quando viene rilevato un CHoCH, l'indicatore disegna:
- ➡️ Una linea orizzontale al livello esatto di breakout (con lo stile e lo spessore configurati)
- 🏷️ L'etichetta "CHoCH" sopra quella linea
- 🟥🟩 Una zona di interesse semi-trasparente
🗺️ 3. Zona di interesse
Immediatamente dopo un CHoCH, l'indicatore delimita automaticamente una zona chiave di prezzo:
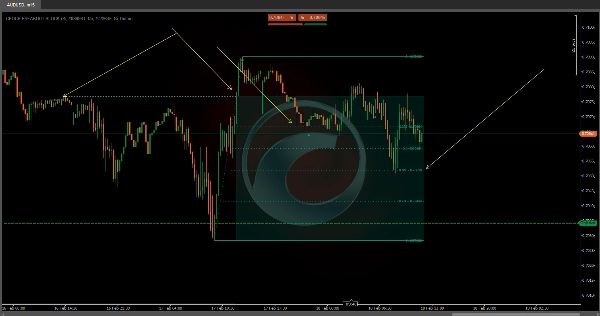
- 🟢 In un CHoCH rialzista: La zona si estende dal livello di breakout (CHoCH) fino al punto più basso trovato tra lo swing strutturale e il momento del breakout. Questa zona rappresenta l'area dove il prezzo potrebbe tornare per cercare liquidità prima di continuare verso l'alto.
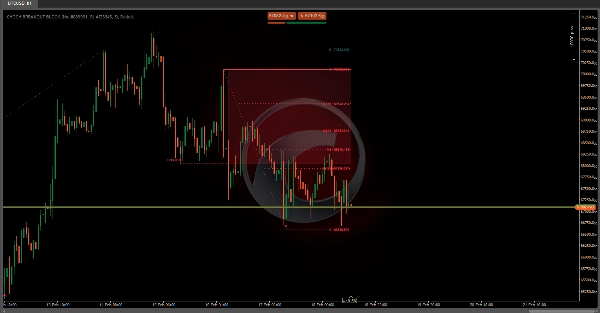
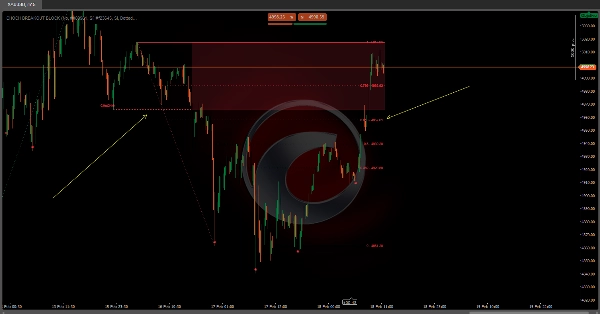
- 🔴 In un CHoCH ribassista: La zona si estende dal punto più alto trovato tra lo swing e il breakout fino al livello CHoCH. Rappresenta l'area dove il prezzo potrebbe tornare per cercare liquidità prima di continuare verso il basso.
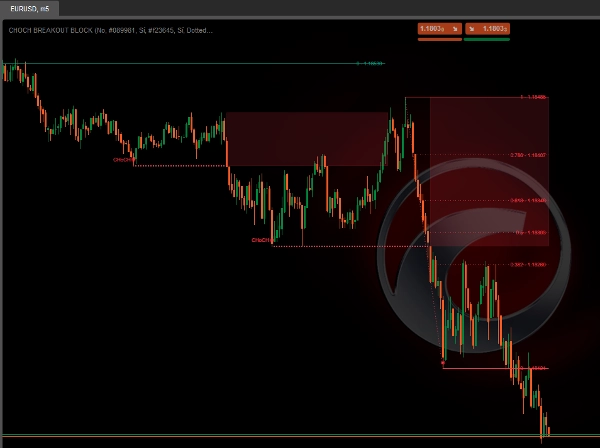
La zona si estende automaticamente barra dopo barra finché il prezzo rispetta i suoi confini. Nel momento in cui il prezzo viola il confine opposto, la zona smette di estendersi — indicando che è stata testata o invalidata.
👁️ Come si vede nell'immagine del grafico, le zone rosse semi-trasparenti rappresentano queste regioni di interesse ribassiste dopo gli eventi CHoCH rilevati.
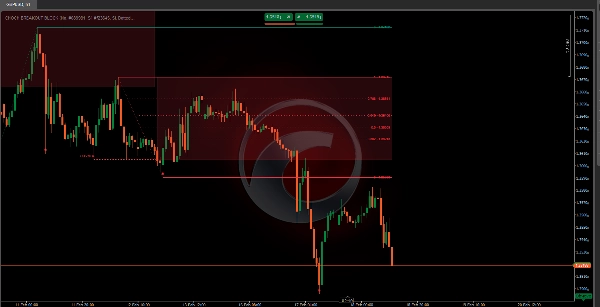
📐 4. Livelli di Fibonacci automatici
Dopo che un CHoCH è stato rilevato, l'indicatore NON disegna immediatamente il Fibonacci. Il Fibonacci appare in una seconda fase, quando il mercato conferma che la nuova direzione ha un reale peso strutturale. Questo avviene in due passaggi:
Passo 1 — Si verifica il CHoCH: 🏷️ La linea di breakout, l'etichetta e la zona di interesse vengono disegnate. Il Fibonacci non è ancora visibile.
Passo 2 — Il mercato forma un nuovo swing a lungo termine nella direzione del CHoCH: 📐 Solo in quel momento l'indicatore proietta automaticamente i livelli di Fibonacci tra il punto di riferimento del breakout e quello swing appena confermato.
📌 Esempio: In un CHoCH rialzista, il Fibonacci sarà disegnato dal punto più basso trovato durante il breakout fino al primo massimo a lungo termine che il mercato forma successivamente. Se il prezzo sta salendo ma non ha ancora consolidato quello swing strutturale, i livelli di Fibonacci non saranno ancora visibili — questo è intenzionale e non un errore.
Una volta attivi, i livelli si estendono barra dopo barra finché la struttura rimane valida, e sono ricalcolati automaticamente se appare un nuovo breakout strutturale. I livelli disponibili sono:
Livello
Significato comune
0
Origine del movimento
Ritracciamento minore
⭐ Primo ritracciamento rilevante
0.5
⭐ Livello medio
⭐ Rapporto aureo
Variante del rapporto aureo
⭐ Ritracciamento profondo
1
Estensione al 100%
🕯️ 5. Rilevamento della candela engulfing
L'indicatore include il rilevamento del pattern di candela engulfing come segnale di congiunzione aggiuntivo:
- ▲ Un engulfing rialzista compare quando una grande candela verde assorbe completamente una precedente piccola candela rossa.
- ▼ Un engulfing ribassista compare quando una grande candela rossa assorbe completamente una precedente piccola candela verde.
Ci sono due modalità di visualizzazione:
- 📋 Tutte: Mostra ogni pattern engulfing che appare sul grafico.
- 🎯 StructureBased: Mostra solo i pattern engulfing che si verificano all'interno di una zona di interesse attiva, aumentando significativamente la rilevanza del segnale.
Riepilogo
When a CHoCH occurs, the indicator marks the breakout level with a horizontal line and label, and automatically creates a semi-transparent interest zone where price is likely to return before continuing in the new direction. This zone extends dynamically as long as price respects its boundaries and is invalidated if price breaks the opposite boundary.
The indicator also projects Fibonacci retracement levels automatically after the market confirms the new trend direction by forming a new long-term swing. Supported Fibonacci levels include 0.236, 0.382, 0.5, 0.618, 0.65, 0.786, and 1. Additionally, it detects bullish and bearish engulfing candle patterns as confluence signals, with options to display all patterns or only those occurring within active interest zones for higher precision.
This tool supports multiple markets including BTCUSD, EURUSD, GBPUSD, NZDUSD, XAUUSD, NAS100, and USDJPY.
Recensioni dei clienti
5 | 100 % | |
4 | 0 % | |
3 | 0 % | |
2 | 0 % | |
1 | 0 % |


