"FollowTheTrend cBot Indicator" logo
FollowTheTrend cBot Indicator
"FollowTheTrend cBot Indicator" uploaded image
14
Sales
443
Free installs

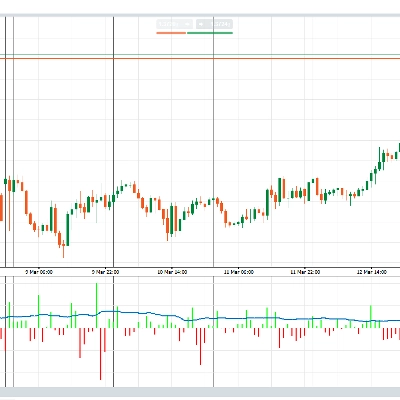
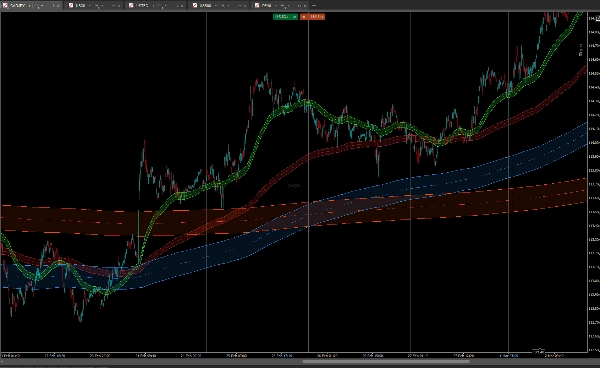
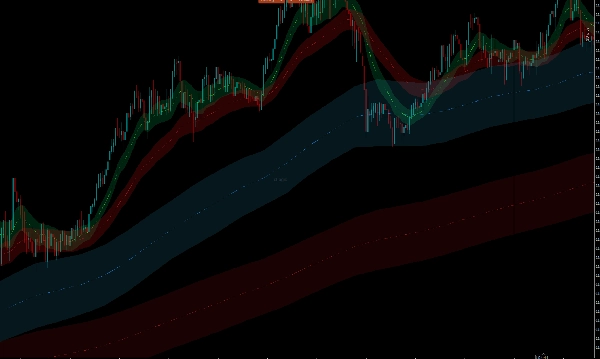
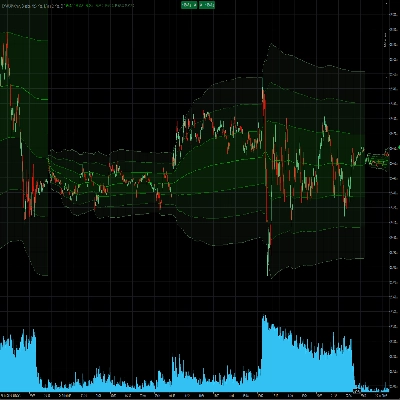
Follow The Trend is an overlay indicator that draws two pairs of Moving Average bands on High and Low prices — a Fast Band and a Slow Band — creating dynamic support and resistance zones that naturally frame price action.

Multi-Timeframe support lets you display bands from a higher timeframe (e.g. Daily, H4) directly on your current chart without switching. MTF bands use separate colors so both timeframes are always visible at a glance.

Linear interpolation smooths transitions between higher timeframe bars, eliminating the staircase effect on lower timeframes.

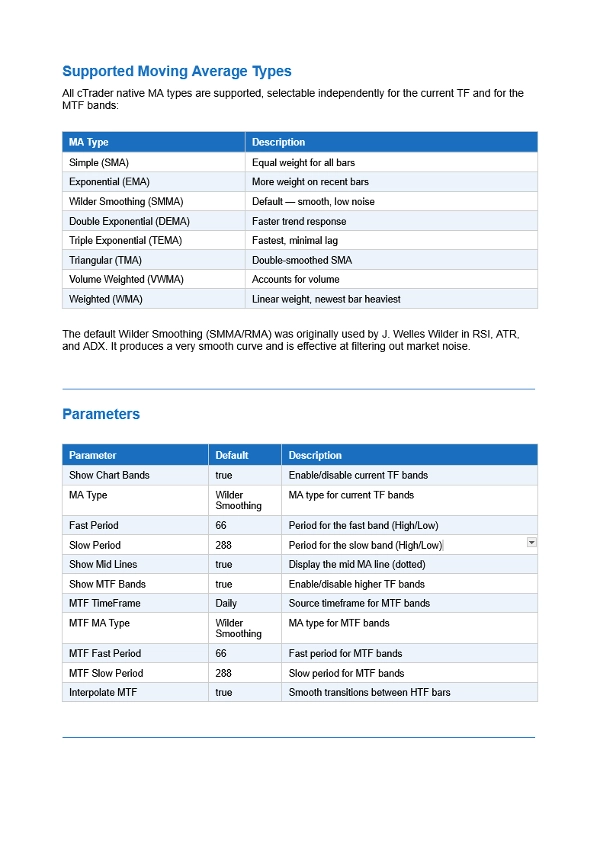
All 8 cTrader MA types are supported — Simple, Exponential, Wilder Smoothing, Double Exponential, Triple Exponential, Triangular, Volume Weighted, and Weighted — selectable independently for current TF and MTF bands.
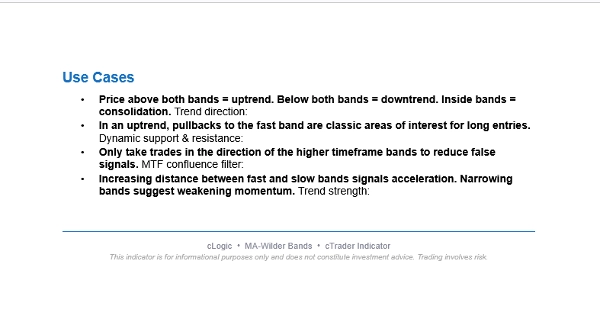
How to read it:

  • Price above both bands → uptrend
  • Price below both bands → downtrend
  • Price inside bands → consolidation
  • Increasing gap between Fast and Slow band → trend acceleration

You can find this cBot robot here:

https://ctrader.com/products/3618?u=cLogic


Indicator profile
0.0
Reviews: 0
Customer reviews
No reviews for this product yet. Already tried it? Be the first to tell others!
Prop
Forex
Breakout
Indices
Grid
AI
XAUUSD
Martingale
USDJPY
Products available through cTrader Store, including trading bots, indicators and plugins, are provided by third-party developers and made available for informational and technical access purposes only. cTrader Store is not a broker and does not provide investment advice, personal recommendations or any guarantee of future performance.

More from this author

The EMA Trend Simple is a trend-following tool designed for simplicity and visual clarity.
MACD Advanced -- It combines the standard MACD logic with a rich set of visual tools
TMA Bands Essentials – Advanced Mean Reversion Tool
EMA Clouds, Multi-Timeframe (MTF) Overlay, Swing High/Low detection, and a smart Dashboard with neutral zone filtering.
HCCC MTF (Hurst Cycle Composite Channel), Designed for Semi-Automated Trading, Interactive MTF Dashboard
The ultimate tool for Price Action and ICT. High, Low and Mid levels for days, weeks Inc. NY Midnight and Custom Range.
Weekly Daily Opening Gaps — NWOG & NDOG Indicator Professional-grade opening gap visualization for institutional traders
EMA MTF TREND PRO - Multi-timeframe trend analysis overlay indicator, 6 timeframes - in one table with ADX
FOLLOW THE TREND XAU EDITION v2.0, Start with $1,000, AI features BE & TP50%, Improved security and performance,
7.9%
5.78
Profit factor
5.36%
Max drawdown
Sessions PRO is a professional session visualization indicator - 4 Fully Customizable Sessions
TMA Band MTF Scanner – Ultimate Reversal & Trend Dashboard
Hurst HCCO Advanced / Cycle Phase Detection / Volatility Filter / Info Table / Momentum Histogram

You may also like

Daily/Weekly/Monthly - Highs & Lows Indicator (Customizable Settings)
Automate candle numbering for any N-bars and plot the High/Low of the last N periods. Fully customizable & Tab-toggle.
Price direction by calculating the probability of reaching new highs/lows. Shows levels & stats📈
Professional Fair Value Gaps with multitimeframe spot on
Filter noise & catch real trends! ADX Pro: precise signals with 3 risk profiles and exhaustion protection. Trade power.
VWAP (EMA) + MVWAP Mean Line — plotted directly on the main chart
Filters market regimes (trend/range/pullback) using MAs, ADX, ATR/BBW Vol, opt. Volume. Helps adapt strategy. 📉📈
Visual tool tracking financial assets' % performance across timeframes, highlighting trends with color-coded insights.
The cTrader Chaos Reversals indicator brings high-quality reversal signals to traders.
Yen Index
Liquidity Cluster Order automatically detects and draws accumulation zones & distribution zones
Enhance Your Trading Strategy with the Larry Williams 9-5-3 Indicator
INSTITUTIONAL Nonlag Candle
PDHL - Previous Day High&Low
Turtle Soup ICT Strategy – Detect liquidity traps & trade smart money moves with precision on cTrader.
This extraordinary multi-timeframe support and resistance indicator is nothing short of market wizardry.
Innovative indicator that highlights trend direction and momentum strength quickly and clearly on Forex charts.
Multi-TF FVG + Smart Fibonacci
14
Sales
443
Free installs