
Description
HCCC MTF - Hurst Cycle Composite Channel (100% FREE)
Overview
The HCCC MTF (Hurst Cycle Composite Channel) is an advanced, fully interactive Multi-Timeframe (MTF) dashboard and channel indicator. Based on the cyclic theories of J.M. Hurst combined with ATR volatility, this tool helps you identify the true market trend and the perfect cyclic turning points (peaks and troughs) across multiple timeframes simultaneously.
The second one dedicated to semi-automatic trading with https://ctrader.com/products/3618?u=cLogic
IMPORTANT: This indicator is completely 100% FREE for everyone. It was specifically developed as the ultimate visual companion for the "Follow The Trend XAU Edition" cBot.
While you can use it perfectly for manual trading, its true power is unlocked when used in a semi-automated setup: You use the HCCC Dashboard to read the higher-timeframe cycle and momentum, and then you enable the Follow The Trend XAU Edition cBot to precisely execute and manage the trades in that direction.
Key Features
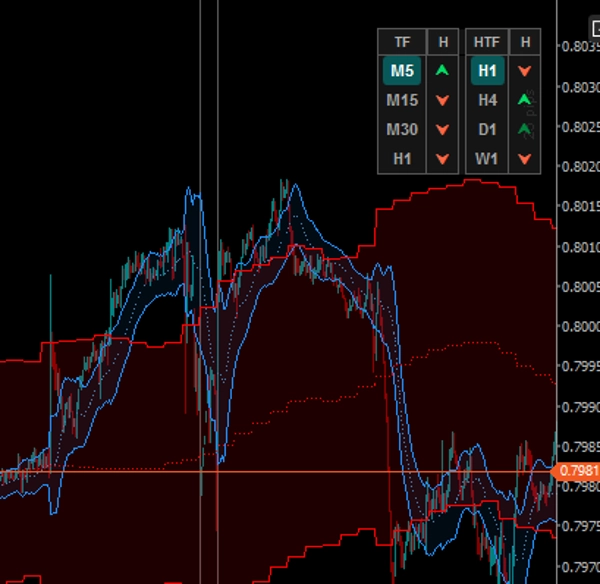
1. Interactive MTF Dashboard (Clickable)
Forget switching back and forth between charts. The on-chart dashboard tracks 4 Lower Timeframes (LTF) and 4 Higher Timeframes (HTF).
- LTF Buttons: Click any LTF button to instantly change your current chart's timeframe.
- HTF Buttons: Click any HTF button to instantly project that specific Higher Timeframe's channel directly onto your current chart!
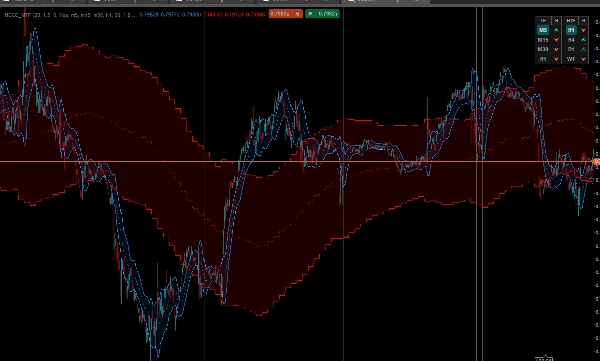
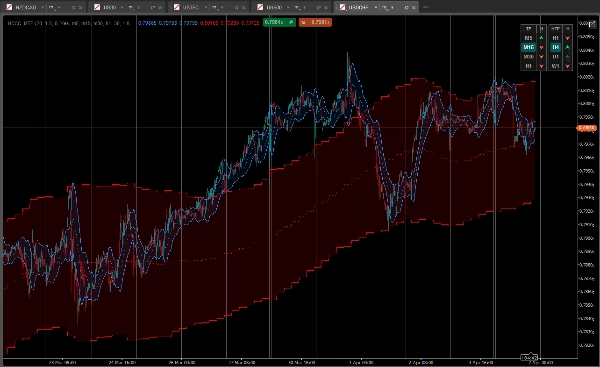
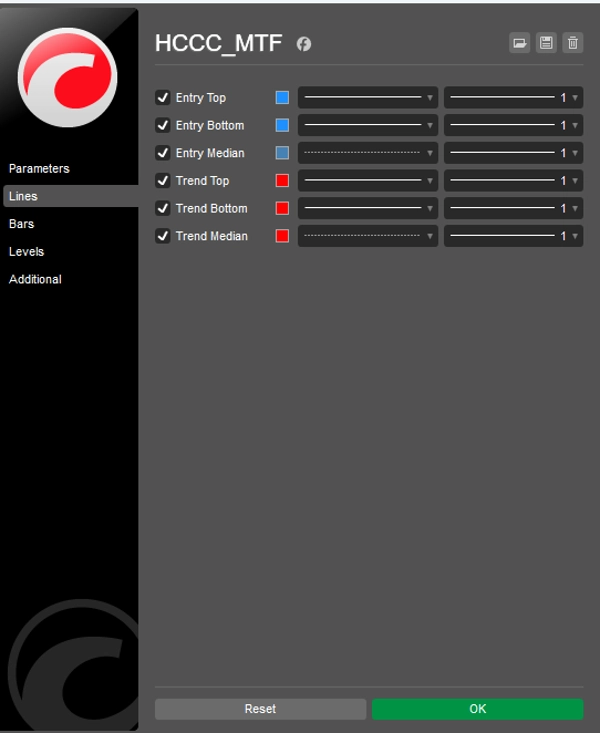
2. Dual Channel Overlay System
The indicator plots two elegant, cloud-filled channels on your chart at the same time:
- Entry Cycle (Blue Cloud): Calculates the Hurst cycle based on your current chart timeframe.
- Trend Cycle (Red Cloud): A macro-view channel calculated from the Higher Timeframe you selected in the dashboard.
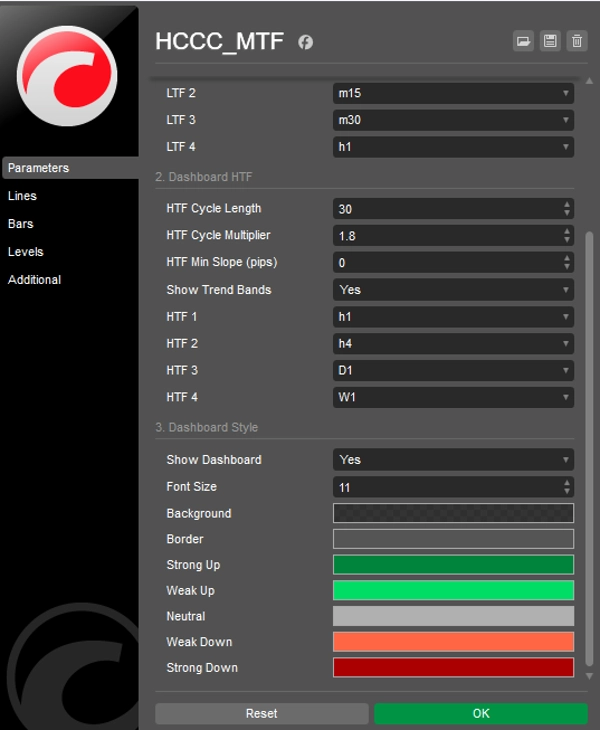
3. Advanced 5-State Cyclic Signals
The dashboard doesn't just show trend direction; it shows the phase of the cycle by analyzing the slope of the median line and the price's position relative to the ATR bands.
- [ ⮝ ] Dark Green (Strong Buy): The median slope is UP, and the price has dropped to the bottom band. This is a cyclic trough (buy the dip).
- [ ⮝ ] Light Green (Weak Buy): The trend is UP, but the price is hovering around the median or upper band.
- [ — ] Gray (Neutral): The cycle is flat. No clear momentum.
- [ ⮟ ] Light Red (Weak Sell): The trend is DOWN, but the price is near the median.
- [ ⮟ ] Dark Red (Strong Sell): The median slope is DOWN, and the price has rallied to the top band. This is a cyclic peak (sell the rally).
How to use it with the "Follow The Trend XAU Edition" cBot?
- Look at the right side of the dashboard (HTF Column). Wait for a clear alignment on the Higher Timeframes (e.g., H4 and D1 showing Dark/Light Green Arrows).
- Look at the left side of the dashboard (LTF Column) to find a localized pullback (e.g., M15 showing a Dark Green "Strong Buy" arrow).
- Once the MTF logic aligns, activate your Follow The Trend XAU Edition cBot in the "BUY" direction and let its algorithms handle the entry, trailing stops, and risk management.
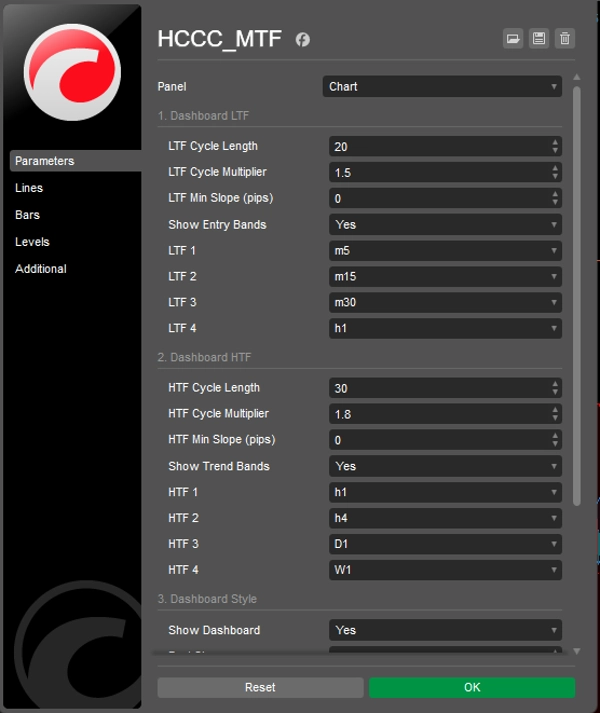
Customization
Everything is fully customizable: Cycle lengths, ATR multipliers, Minimum slope sensitivity (in pips) to filter out noise, and full control over the UI colors and positioning.
Download it now for FREE and take your semi-automated trading to the next level!
Summary
It overlays two cloud-filled channels: a blue "Entry Cycle" channel based on the current timeframe and a red "Trend Cycle" channel derived from a selected higher timeframe. The dashboard provides advanced five-state cyclic signals indicating strong or weak buy/sell conditions and neutral phases by analyzing the slope of the median line and price position relative to ATR bands.
The indicator is fully customizable, including cycle lengths, ATR multipliers, slope sensitivity, and UI appearance. It is intended to complement the "Follow The Trend XAU Edition" cBot by providing visual cycle and momentum analysis to guide semi-automated trade execution and management. The HCCC MTF supports various markets including Forex, commodities, indices, stocks, and cryptocurrencies.


