
SMCTimingIndicator
Indicator
143 downloads
Version 1.0, Dec 2025
Windows, Mac
Description
📜 Description
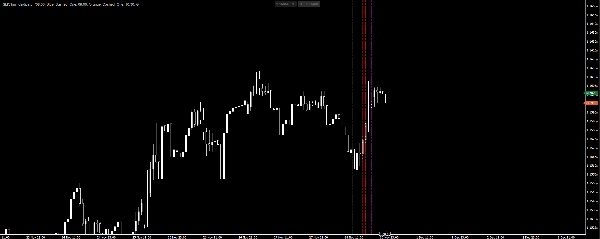
SMC Timing Indicator is a customizable tool for the cTrader platform that helps traders visualize intraday timing and market session structure. It is designed especially for those applying Smart Money Concepts (SMC) and ICT strategies, where precise timing is crucial.
✨ Key Features
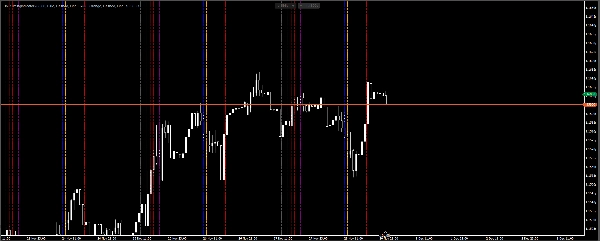
- Up to 8 configurable vertical lines per day
- Full customization of time, color, style, and thickness for each line
- Option to display historical lines across previous trading days
- UTC offset parameter for flexible time zone alignment
- Clean, modular architecture using enums, helpers, and services
- Open‑source and free to use and share
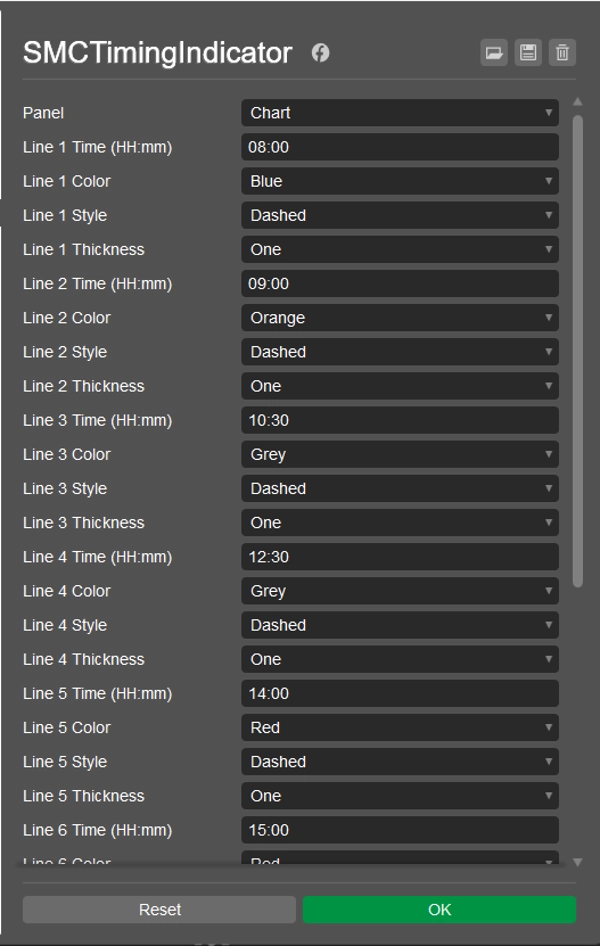
⚙️ Parameters
Each line has its own set of parameters (time, color, style, thickness), allowing you to tailor the indicator to your trading needs.
📈 Usage
- Install the indicator in cTrader Automate.
- Configure times and styles for your lines.
- Adjust the UTC offset to match your local time zone or broker server time.
- Enable Show Historical Lines to visualize past session timings.
📦 License
Published under the MIT License – free to use, modify, and distribute.
Summary
AI summary
SMC Timing Indicator is a customizable indicator for the cTrader platform designed to mark trading sessions with vertical lines. It supports up to eight configurable vertical lines per day, each with adjustable time, color, style, and thickness settings. The indicator includes a UTC offset parameter to align session times with different time zones or broker server times. Users can enable the display of historical session lines to visualize past trading days. The tool is particularly suited for traders using Smart Money Concepts (SMC) and ICT strategies, where precise intraday timing and market session structure visualization are important. It features a modular architecture and is published under the MIT License, allowing free use, modification, and distribution. Installation and configuration are done through cTrader Automate.
Indicator profile
Customer reviews
0.0
Reviews: 0
Customer reviews
No reviews for this product yet. Already tried it? Be the first to tell others!
Discussion
FAQ
Forex
EURUSD
SMC
Products available through cTrader Store, including trading bots, indicators and plugins, are provided by third-party developers and made available for informational and technical access purposes only. cTrader Store is not a broker and does not provide investment advice, personal recommendations or any guarantee of future performance.
More from this author

You may also like


Price
Since 24/09/2025
368
Free installs