الوصف
مؤشر ضغط الشمعة (CPI) هو مؤشر قوي وسهل الاستخدام مصمم للكشف عن ضغط الشراء والبيع الخفي وراء كل شمعة. بدلاً من مجرد إظهار ما إذا كان السعر قد تحرك صعودًا أو هبوطًا، يغوص CPI أعمق في مدى قوة سيطرة المشترين أو البائعين على السوق داخل كل شمعة. هذا يجعله أداة فريدة لتحديد قوة الاتجاه، واكتشاف الانعكاسات مبكرًا، وتأكيد نقاط الدخول أو الخروج بدقة أعلى.
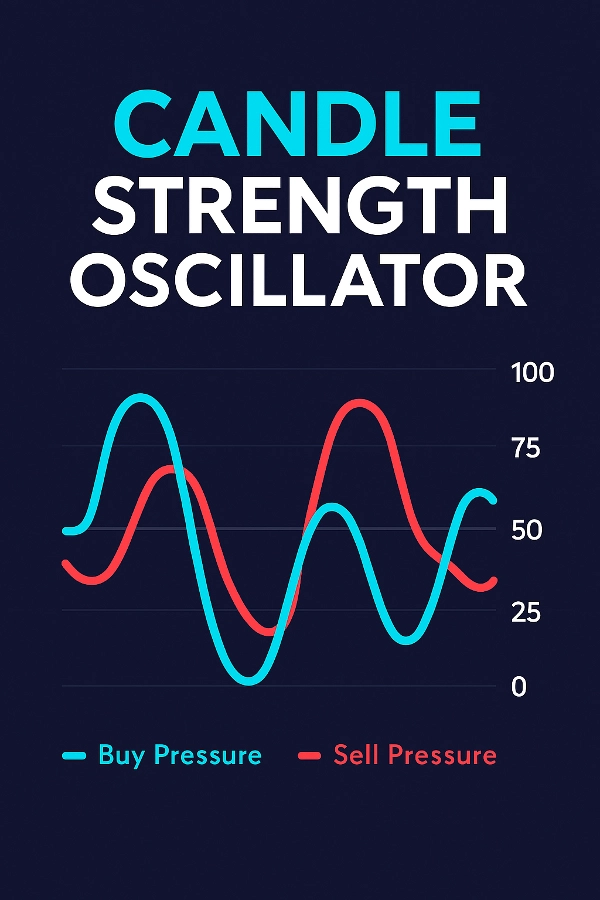
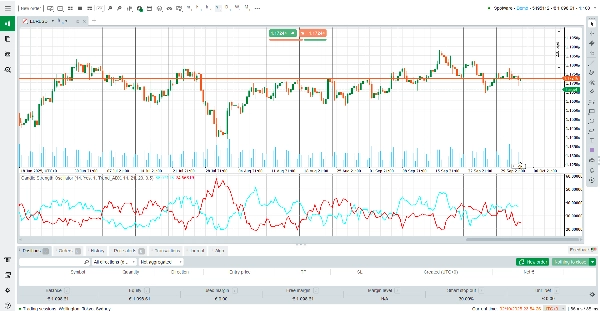
على عكس المذبذبات التقليدية التي تتفاعل فقط مع السعر، يجمع CPI بين ديناميكيات جسم الشمعة، والزخم، وتوزيع الحجم، وتحليل الاتجاه (ADX أو EMA) ليمنحك رؤية شاملة لضغط السوق. مع خطين ناعمين – ضغط الشراء (السماوي) وضغط البيع (الأحمر) – يمكن للمتداولين رؤية أي جانب من السوق يسيطر فورًا.
كيفية قراءة المؤشر
ضغط الشراء (الخط السماوي) – يمثل شدة السيطرة الصعودية. الخط الصاعد يظهر زيادة هيمنة المشترين.
ضغط البيع (الخط الأحمر) – يمثل شدة السيطرة الهبوطية. الخط الصاعد يظهر قوة بيع أقوى.
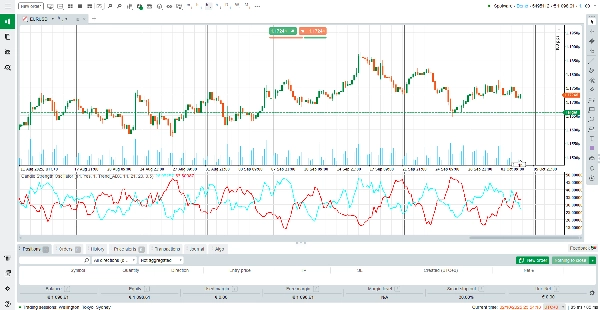
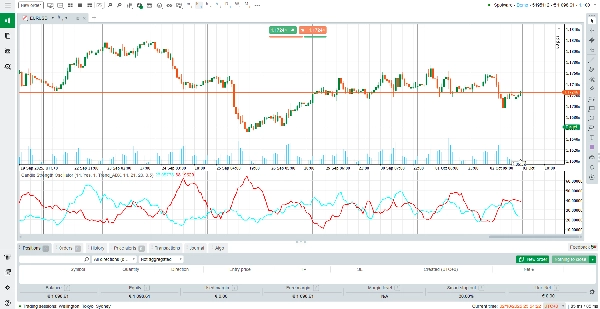
التقاطع – عندما يعبر خط الشراء فوق خط البيع، يشير ذلك إلى ضغط صعودي أقوى (فرصة شراء محتملة). وعندما يعبر خط البيع فوق، يهيمن الضغط الهبوطي (فرصة بيع محتملة).
منطقة المستوى 50 – القراءات حول المنتصف (≈50) تشير إلى توازن بين المشترين والبائعين، في حين أن القراءات القصوى (فوق 75 أو تحت 25) تظهر ضغطًا اتجاهيًا قويًا.
تعزيز عامل الاتجاه – يتكيف المؤشر مع إشاراته بناءً على تأكيد الاتجاه من ADX أو ميل EMA، مما يقلل الإشارات الخاطئة خلال الأسواق الجانبية.
كيف يعمل المؤشر
يحسب CPI الضغط باستخدام نموذج موزون يأخذ في الاعتبار:
هيكل الشمعة: حجم الجسم وموقع الإغلاق بالنسبة للأعلى/الأسفل.
الزخم: حركة السعر مقارنة بالشمعة السابقة.
الحجم: توزيع حجم التيك يضمن أن التحركات ذات الحجم العالي تحمل أهمية أكبر.
تأكيد الاتجاه: إما قوة ADX أو ميل EMA يضيف عامل تعزيز لمواءمة الإشارات مع الاتجاه السائد.
التنعيم: فلتر SMA معرف من قبل المستخدم يضمن خطوطًا ناعمة ومستقرة دون فقدان الاستجابة.
تعني هذه الصيغة المتقدمة أن CPI لا يتفاعل فقط مع السعر، بل يفهم أيضًا سبب تحرك السعر – مما يمنح المتداولين رؤية أعمق لسلوك السوق.
الميزات الرئيسية
تصوير بخطين – قارن فورًا ضغط الشراء مقابل البيع بخطوط ملونة (السماوي للمشترين، الأحمر للبائعين).
تعزيز الاتجاه التكيفي – يدمج ADX أو EMA لتأكيد اتجاه الاتجاه وتقليل الإشارات الخاطئة.
حساب مدرك للحجم – موزون بحجم التيك لتسليط الضوء على التحركات المدعومة بمشاركة السوق الحقيقية.
عرض ناعم ونظيف – فلتر SMA مدمج لقراءات ناعمة دون تشويش أو تأخير.
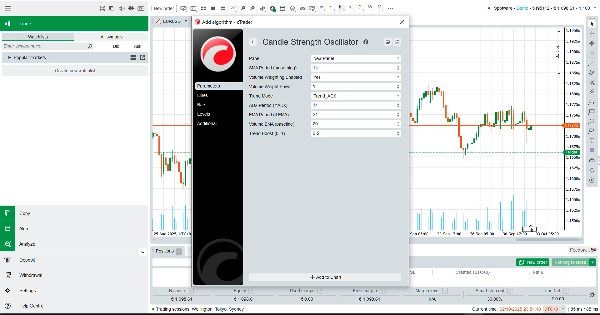
قابل للتخصيص بالكامل – فترات قابلة للتعديل، وتوزيع الوزن، وشدة التعزيز لتناسب أي أسلوب تداول.
لماذا تستخدم مؤشر ضغط الشمعة؟
CPI مثالي للمتداولين الذين يرغبون في تجاوز حركة السعر البسيطة ورؤية المعركة الحقيقية بين المشترين والبائعين. سواء كنت متداول سكالبير، أو متداول تأرجح، أو متابع اتجاه، يمنحك هذا المؤشر المجاني الوضوح اللازم لتوقيت الدخول، وإدارة المخاطر، والبقاء متوافقًا مع الاتجاه الحقيقي للسوق.
قم بتنزيل مؤشر ضغط الشمعة (CPI) اليوم – وتداول بثقة من خلال فهم القوى الخفية التي تحرك كل شمعة.
الملخص
The indicator displays two smooth lines: Buy Pressure (cyan) and Sell Pressure (red). Crossovers between these lines signal shifts in market dominance, helping traders identify trend strength, potential reversals, and optimal entry or exit points. Readings near the midpoint indicate balance, while extremes suggest strong directional pressure.
CPI incorporates volume-weighted calculations and trend-based boosts to reduce false signals during sideways markets. It includes a smoothing filter for stable, responsive readings and offers customization of periods, weighting, and trend boost intensity.
This tool is applicable across various markets including Forex, commodities, stocks, and cryptocurrencies, supporting trading strategies such as scalping and breakout trading. It aims to provide traders with enhanced insight into market dynamics beyond simple price action.
تقييمات العملاء
5 | 0 % | |
4 | 100 % | |
3 | 0 % | |
2 | 0 % | |
1 | 0 % |