
説明
それが何をするか
スーパートレンド移動平均は、従来の移動平均の核心的な制限、すなわちトレンドの展開に適応しない固定期間を解決します。
短期間は反応が速いですが、騙しに遭いやすいです。長期間はノイズを平滑化しますが、強い動きの際には遅れが大きくなります。設定に関係なく、数値を推測し、市場が協力することを願うしかありません。
このインジケーターはその推測を排除します。
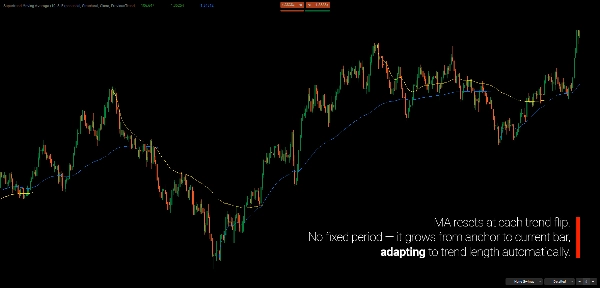
任意のバー数で価格を平均化する代わりに、現在のトレンドが 構造的に始まった瞬間から移動平均を計算します。トレンドが長く続くほど、MAは自然に長くなります。短いトレンドは応答性を保ち、長期トレンドは自動的に滑らかになります。
結果として、トレンドに沿って成長する移動平均が得られます。
スーパートレンドに基づく構造的変化にアンカーされ、このMAは最適化、カーブフィッティング、手動調整なしでリアルタイムに市場のリズムに適応します。期間を定義するのは構造であり、トレーダーではありません。
なぜ構造的スーパートレンドなのか?
元のスーパートレンドは価格が バンドを超えて終値をつけたときに方向を反転します。これはクリーントレンドではうまく機能しますが、乱高下する状況では誤ったシグナルが発生しやすいという一般的な不満を生みます。
問題点
バンドをわずかに超えて終値をつけた単一のボラティリティの高いローソク足が反転を引き起こします — たとえ広範なトレンドが維持されていても。元のスーパートレンドを追うトレーダーはしばしば以下を経験します:
- 統合期間中の騙し
- 有効なトレンドからの早期退出
- 誤った反転後の悪い価格での再エントリー
解決策
構造的スーパートレンドは、元のスーパートレンドの概念を拡張し、一時的なボラティリティではなく構造的な変化をより正確に反映します。真の方向転換が起きたことを確認するまでノイズを除去します。
その結果、誤った反転が減り、実際のトレンド変化とより良く一致します。
なぜ両方を保持するのか?
元のスーパートレンドは無用ではありません — それは異なる問いに答えています。
- 構造的 は主要なトレンド(「大局」)を示します
- 元の はそのトレンド内のモメンタムの変化(インパルス対調整)を示します
両方のラインが一致するとき:強い方向性の確信。乖離するとき:動きは調整的であり、真の反転ではない可能性があります。
この二層の視点は、どちらのライン単独では得られないコンテキストを提供します。
核心概念
従来のMAは次の問いに答えます: 「N本のバーの平均価格は?」
このインジケーターは次の問いに答えます: 「現在のトレンドが始まってからの平均価格は?」
MAはスーパートレンドに直接基づいて構築されています:
- スーパートレンドがトレンドの反転を検出する
- インジケーターは前のトレンドの極端な終値を見つける(新しい下降トレンドの場合は最高値、新しい上昇トレンドの場合は最安値)
- MAはそのポイントにアンカーし、現在のバーまで計算する
- スーパートレンドが再び反転すると、MAは新しいアンカーにリセットされる
スーパートレンドは トレンドを定義し、MAは それを測定します。これらは別々のツールではなく、単一のシステムとして機能します。
どのスーパートレンドがMAを駆動するかを選択します:
- 構造的 — リセットが少なく、主要トレンドを追跡
- 元の — リセットが多く、短期モメンタムを追跡
主な特徴
二重スーパートレンド分析
- 構造的スーパートレンド は構造的に適応したスーパートレンドモデルを用いて主要トレンド方向を特定
- 元のスーパートレンド はトレンド内のインパルス対調整の挙動を明らかにする
- 視覚的比較により両者の一致(確信)と乖離(注意)を示す
適応型アンカーベース移動平均
- MAは前のトレンドの極端な終値に自動的にアンカーされる
- 期間はアンカーポイントから動的に成長 — 固定設定不要
- 3種類のMAタイプ:単純、指数、アルノー・ルグー(ALMA)
- トレンド方向に応じて色分けされ、即時のバイアス認識が可能
マルチタイムフレームコンテキスト
- 低時間軸チャートを見ながら高時間軸スーパートレンドにMA計算を適用可能
- 時間軸を切り替えずにH1チャートで日足トレンドMAを表示
- 明確な警告付きの自動バー必要数検出
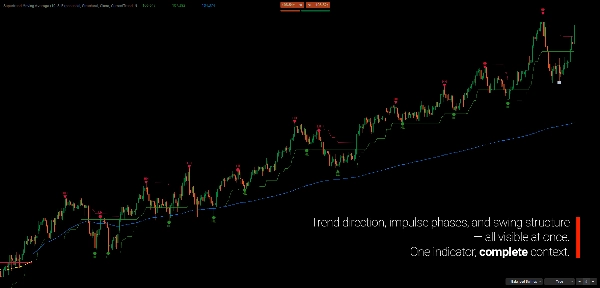
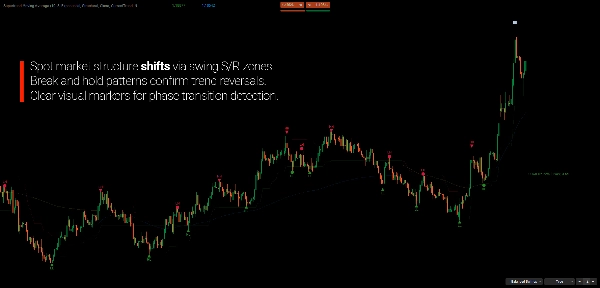
統合スイング検出
- 3つの検出モード:マイナー、バランス、メジャー
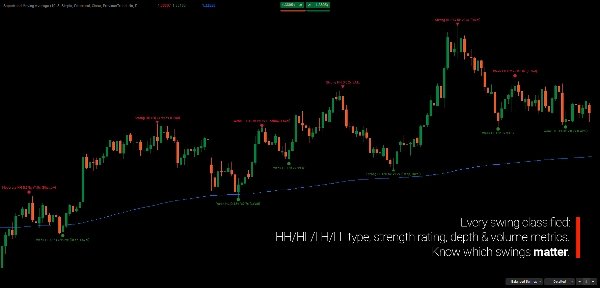
- スイング強度分類(弱、中、強)
- HH/HL/LH/LLラベルでトレンド構造を確認
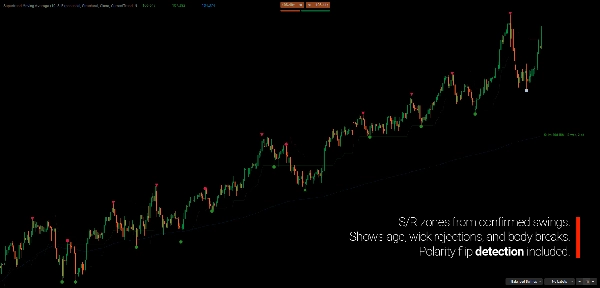
- 極性反転追跡付きのオプションのサポート/レジスタンスゾーン
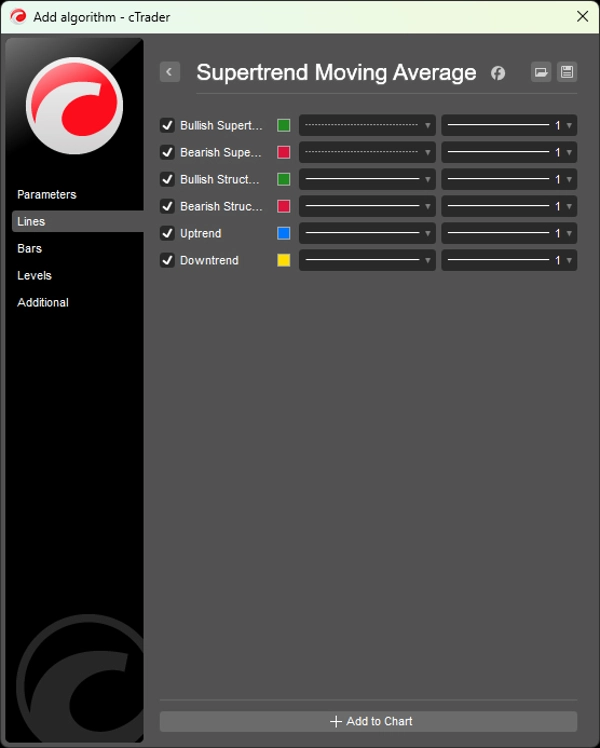
チャートの読み方
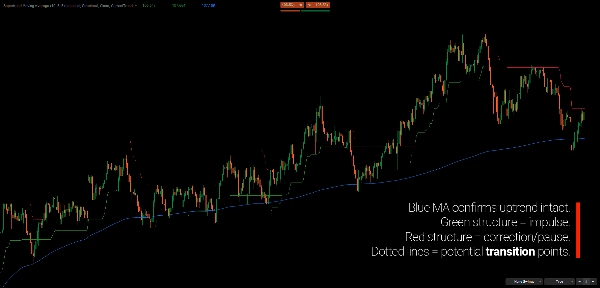
- 緑の構造ライン: 強気の構造的トレンド(サポート)
- 赤の構造ライン: 弱気の構造的トレンド(レジスタンス)
- 点線: 元のスーパートレンド — 構造がクラシックと異なる場合を示す
- 青のMA: アンカーからの上昇トレンド平均
- 黄色のMA: アンカーからの下降トレンド平均
- スイングマーカー: 強度アイコン付きの確認済み転換点
トレンド整合性チェック:
- 構造 + 元のが一致 → 高い確信の動き
- 構造 + 元のが乖離 → 潜在的な調整または移行
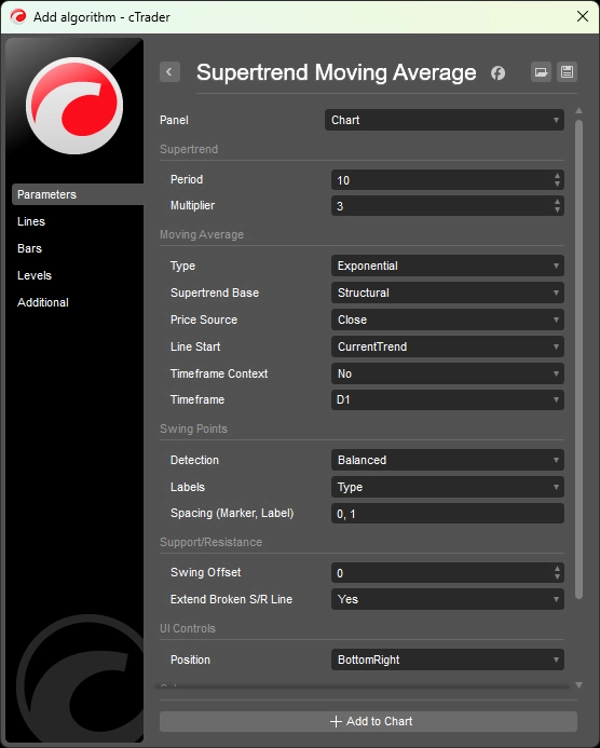
パラメーター
スーパートレンド
- 期間(デフォルト: 10)
- 乗数(デフォルト: 3.0)
移動平均
- タイプ: なし、単純、指数、アルノー・ルグー移動平均(ALMA)
- スーパートレンドベース: 構造的(デフォルト)または元の
- 価格ソース: 終値、始値、高値、安値、中央値、典型値、平均
- ライン開始: 現在のトレンドまたは前のトレンド
- 時間軸コンテキスト: 時間軸選択で有効/無効
スイングポイント
- 検出モード: なし、マイナー、バランス、メジャー
- ラベル表示: なし、タイプ(HH/LL)、詳細
- カスタマイズ可能な色と間隔
対象ユーザー
このインジケーターはシグナルではなく構造で考えるトレーダー向けに設計されています。
完璧なエントリーを追いかけるよりも、トレンド内の自分の位置を理解することを重視するなら、このツールはあなたのために作られました。
これは トレンドおよびスイングトレーダー に適しており、固定期間の移動平均やパラメーターの絶え間ない最適化に頼らずにトレンドの発展を客観的に追跡したい人向けです。
マルチタイムフレーム分析者 は実行チャート上で高時間軸の構造的コンテキストを直接見ることができ、裁量トレーダー はアンカーされたMAをプルバック、継続、トレンドの消耗の動的な参照として使用できます。
これはプラグアンドプレイのシグナルジェネレーターではありません。これは 明確さ、一貫性、構造的論理 を意思決定に重視するトレーダーのためのコンテキストフレームワークです。
何が違うのか
取引の決定はしばしば馴染みのあるトレードオフを伴います:速いがノイズが多いか、滑らかだが遅いか。
このインジケーターは市場の実際の展開に適応します。短いトレンドは応答性の高いMAを生み出し、長いトレンドは自然に滑らかなものに進化します。最適化は不要で、構造が期間を定義します。
構造的スーパートレンドと元のスーパートレンドを比較することで、トレンド継続とトレンド内の調整動きを区別するための明確なコンテキストを提供します。
---
市場構造の理解
市場構造は、価格が単一のローソク足やインジケーターではなく、拡大と収縮の連続を通じてどのように進化するかを研究するものです。トレンドは単一の動きではなく、スイング間の関係によって定義されます — 上昇トレンドでは高値と安値が切り上がり、下降トレンドでは高値と安値が切り下がります。
この視点から、トレンドは予測するものではなく、 観察し検証するものです。重要なのは現在のバーで価格が上昇しているか下降しているかではなく、基盤となる構造が維持されているか劣化し始めているかです。
これが構造ベースの分析が完璧なエントリーのタイミングよりも コンテキストに重点を置く理由です:市場が現在のフェーズのどこに位置しているか、動きがインパルスか調整か、新しい情報が既存の構造にどのように適合するか。
市場構造に基づいて構築されたインジケーターは意思決定を置き換えるものではなく、 価格がすでに伝えていることのより明確な解釈を支援するためのものです。
---
取引にはリスクが伴います。このインジケーターはテクニカル分析ツールです — 常に適切なリスク管理を適用してください。
概要
The indicator integrates dual Supertrend analyses: a Structural Supertrend that identifies major trend direction by filtering out noise and confirming genuine directional changes, and the Original Supertrend that highlights momentum shifts within the trend. Comparing these two provides context for distinguishing strong trend continuation from corrective movements.
Key features include:
- Adaptive anchor-based moving averages with options for Simple, Exponential, or Arnaud Legoux (ALMA) types.
- Multi-timeframe capability to apply higher timeframe Supertrend context on lower timeframe charts.
- Integrated swing detection with configurable modes and strength classification.
- Color-coded trend lines and swing markers for clear visual interpretation.
This tool is suited for trend and swing traders, multi-timeframe analysts, and discretionary traders seeking a structural framework to track trend development and market rhythm objectively. It emphasizes market structure and context over fixed signals, supporting clearer interpretation of price behavior.
カスタマーレビュー
5 | 100 % | |
4 | 0 % | |
3 | 0 % | |
2 | 0 % | |
1 | 0 % |


