Description
Momentum d'apprentissage automatique KNN Ne soyez plus à la traîne. Commencez à prédire. Analyse K-Nearest Neighbors de qualité institutionnelle.
Paramètres par défaut optimisés pour XAUUSD. Fonctionne sur n'importe quelle période — choisissez en fonction de votre style de trading. Les périodes plus longues offrent des signaux plus clairs et à plus forte probabilité. Les périodes plus courtes génèrent plus de signaux avec un peu plus de bruit. Voir le guide des périodes ci-dessous.
🥈 Aussi disponible : version bot automatisée XAGUSD Vous aimez la logique ? Allez plus loin. Une version bot dédiée de cet indicateur — spécialement ajustée pour XAGUSD (Argent) — est disponible sur la marketplace. Il fonctionne en mode entièrement automatisé, exécutant des trades pour vous sans intervention manuelle. Prix bas par rapport au ROI qu'il est conçu pour générer.
👉 KNN XAGUSD Bot — Voir sur cTrader Market
⏱ Guide des périodes
PériodeVolume de signauxNotes
M5
Très élevé
Plus de bruit — nécessite une discipline et un filtrage plus stricts pour éviter le sur-trading.
M8
Élevé (PAR DÉFAUT)
La base optimisée. Meilleur équilibre entre fréquence des signaux et précision pour XAUUSD.
M15
Moyen
Signaux plus propres et de meilleure qualité avec moins d'entrées par session.
M30 / H1
Faible
Précision maximale — mieux adapté aux configurations de type swing nécessitant plus de patience.
Les paramètres par défaut ont été testés en arrière sur M8. Si vous changez de période, pensez à ajuster la période ATR et les multiplicateurs SL/TP en conséquence.
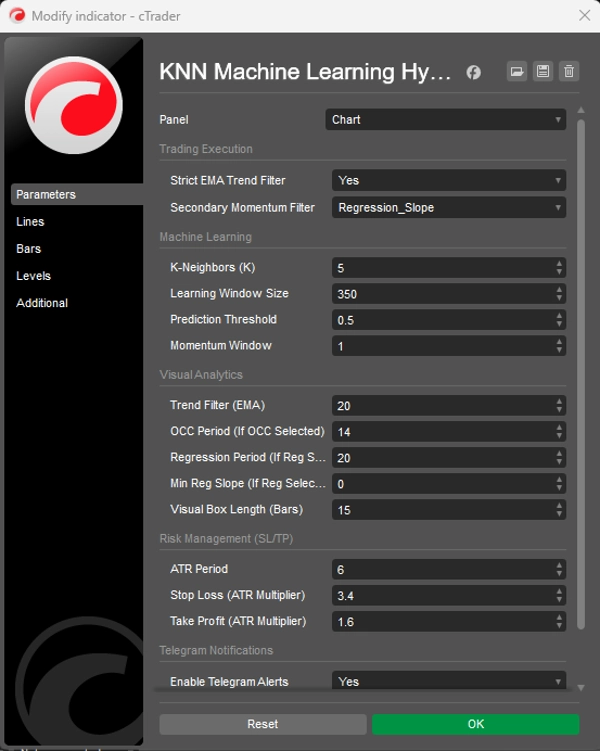
⚙️ Paramètres par défaut
Fenêtre d'apprentissage (350) — Nombre de chandeliers historiques que le moteur KNN analyse pour trouver des correspondances de motifs.
Seuil de prédiction (0.5) — Score de confiance minimum requis avant qu'un signal soit généré.
Période ATR (6) — Période utilisée pour calculer la plage vraie moyenne pour le dimensionnement SL/TP.
Multiplicateur Stop Loss (3.4) — Distance SL = ATR × 3.4. Plus large pour laisser de la marge à la volatilité de l'or.
Multiplicateur Take Profit (1.6) — Distance TP = ATR × 1.6. Plus serré pour sécuriser rapidement les profits et maintenir un taux de réussite élevé.
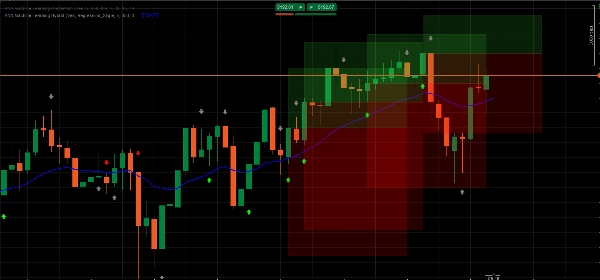
Filtre de tendance EMA (20) — Période de l'EMA utilisée comme filtre de tendance — la ligne bleue sur votre graphique.
🤖 Moteur prédictif KNN Compresse la déviation RSI et MA en un algorithme de correspondance historique. À chaque chandelier, il analyse les 350 dernières barres et trouve les 5 moments passés les plus similaires pour prévoir la direction.
📈 Filtre de tendance EMA strict Supprime automatiquement les configurations contre-tendance à faible probabilité. Seuls les signaux alignés avec la tendance générale sont marqués comme à haute probabilité.
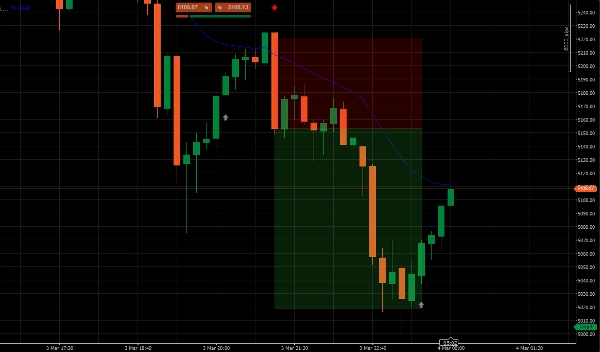
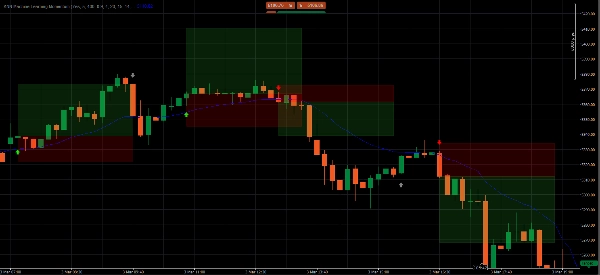
📦 Zones cibles ATR dynamiques Projette des boîtes colorées transparentes pour vos zones Take Profit et Stop Loss, s'adaptant en temps réel à la volatilité actuelle du marché via l'ATR.
🧹 Gestionnaire de mémoire UI Garde votre graphique propre en supprimant automatiquement les anciennes zones. Seules les 5 configurations les plus récentes sont affichées à tout moment.
📲 Alertes push Telegram Intégration webhook intégrée envoyant des alertes de trade instantanées avec les prix exacts d'entrée, TP et SL directement sur votre téléphone.
📊 Lecture des signaux
🟢 Flèche verte brillante — ACHAT à haute probabilité KNN prédit que le prix va monter ET le prix est au-dessus de l'EMA. Alignement complet de la tendance. Ce sont les configurations premium à trader.
🔴 Flèche rouge brillante — VENTE à haute probabilité KNN prédit que le prix va baisser ET le prix est en dessous de l'EMA. Alignement complet de la tendance. Entrez à la clôture du chandelier signal.
⚪ Flèche grise — Contre-tendance (NE PAS TRADER) Changement de momentum détecté, mais contre la tendance générale. Affiché uniquement pour information — probabilité significativement plus faible.
▶️ Guide d'exécution
- Attendez une flèche verte brillante ou rouge brillante — ignorez complètement les signaux gris.
- Attendez que le chandelier signal soit complètement fermé avant d'entrer.
- Placez SL et TP au bord horizontal extérieur de chaque boîte — le bord le plus éloigné de votre prix d'entrée.
❓ FAQ
Pourquoi une flèche apparaît-elle ? À chaque chandelier, l'algorithme capture le momentum RSI et MA actuel, analyse les 350 dernières barres pour les 5 moments mathématiquement les plus similaires, et prédit la direction en fonction de la trajectoire des prix à partir de ces moments.
Qu'est-ce qui différencie une flèche brillante d'une flèche grise ? Les flèches brillantes = signal IA et tendance EMA en plein accord — probabilité la plus élevée. Les flèches grises = momentum détecté mais contre-tendance — signalé comme trop risqué pour trader.
Quelle période devrais-je utiliser ? M8 est la valeur par défaut optimisée. Les périodes plus longues (M15, M30, H1) donnent moins de signaux mais plus propres. M5 donne plus de signaux mais demande une discipline de filtrage plus stricte.
Où placer exactement SL et TP ? Au bord horizontal extérieur de chaque boîte colorée — le bord le plus éloigné de votre prix d'entrée.
Puis-je utiliser ceci sur des actifs autres que l'or ? Oui — applicable à tout actif sur cTrader. Cependant, les paramètres ont été testés spécifiquement pour XAUUSD. D'autres instruments bénéficieront d'une période d'ajustement des paramètres.
⚠️ Avertissement sur les risques Le trading sur le marché des changes, des matières premières et des CFD avec effet de levier comporte un niveau de risque élevé et peut ne pas convenir à tous les investisseurs. Cet indicateur est un outil d'analyse quantitative à des fins éducatives et informatives uniquement — il ne constitue pas un conseil financier. Les performances passées ne préjugent pas des résultats futurs. Testez toujours sur un compte démo avant de risquer du capital réel.
Résumé
Key functionalities include dynamic Average True Range (ATR)-based stop loss and take profit target zones that adapt to market volatility, and a UI memory manager that keeps charts clear by displaying only the five most recent setups. Signals are visually represented by arrows: bright green for high-probability buy, bright red for high-probability sell, and gray for counter-trend momentum (not recommended for trading). The indicator supports multiple timeframes, with M8 as the default optimized setting balancing signal frequency and accuracy.
Additionally, it integrates Telegram push alerts via webhook, delivering real-time trade signals with precise entry, stop loss, and take profit levels. Users are advised to wait for signal candle closure before entering trades and to place stops and targets at the edges of the ATR target zones. Parameters such as learning window, prediction threshold, ATR period, and multipliers for stop loss and take profit are configurable to suit different trading styles.