Описание
Проблема: Перегрузка информацией
Большинство трейдеров терпят неудачу, потому что их графики загромождены запаздывающими индикаторами и слишком большим количеством линий. Они теряют из виду самое важное: Структуру рынка.
Решение: Структура трендового смещения
Этот индикатор — это мощный "Два в одном" для платформы cTrader. Он сочетает профессиональное Обнаружение Swing с объективным Оценочным механизмом, который точно показывает, кто контролирует рынок.
Ключевые особенности:
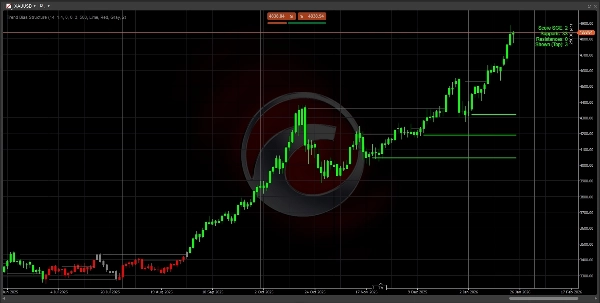
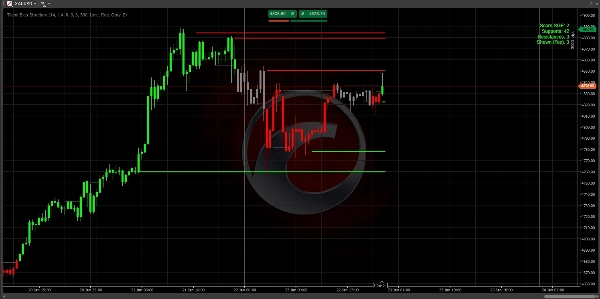
- Умное отображение структуры: Автоматически определяет значимые уровни поддержки и сопротивления с использованием волатильности, отфильтрованной ATR.
- Оценочный механизм SGE: Уникальная система оценок (-2, 0, +2), которая рассчитывает силу тренда на основе количества пробитых структурных уровней.
- Технология анти-загромождения: Отображает только 3 ближайших релевантных уровня к текущей цене. Ваш график остается чистым, профессиональным и удобным для действий.
- Обнаружение импульса: Использует логику "Большой свечи", чтобы вы торговали только движениями с реальной институциональной поддержкой.
- Полная настройка: Настраивайте чувствительность под конкретный актив (XAUUSD, Forex или индексы).
Как торговать с этим индикатором:
- Проверьте оценку: Ищите +2 (бычий) или -2 (медвежий).
- Ждите отката: Позвольте цене вернуться к одной из нарисованных линий структуры.
- Выполните сделку: Торгуйте в направлении смещения, используя уровни как точки входа/выхода.
Технические характеристики
- Платформа: cTrader
- Язык: C# (.NET)
- Таймфреймы: Работает на всех таймфреймах (от M1 до месячного).
- Активы: Оптимизирован для пар с высокой ликвидностью (XAUUSD, EURUSD, GBPUSD).
Примечание: Начальные настройки: Для большинства основных пар настройки по умолчанию оптимальны. Если вы торгуете волатильными индексами, возможно, стоит увеличить Range Global ATR Mult до 2.0
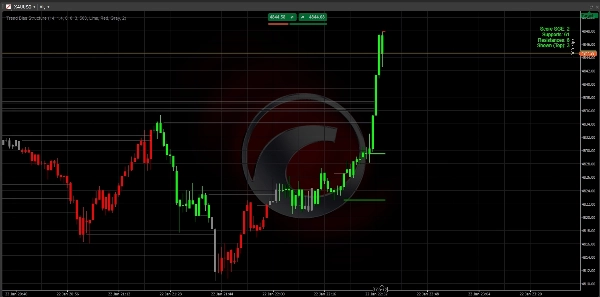
Важно: Чтение панели управления
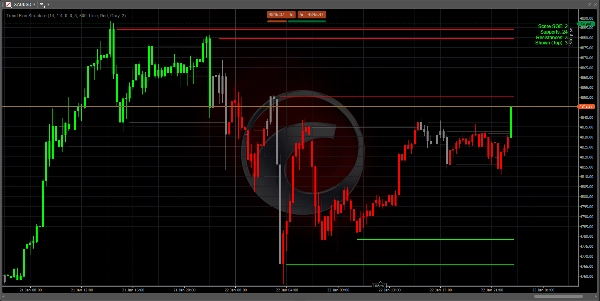
Панель в правом верхнем углу — ваш командный центр:
- Оценка +2 (Зеленый): Сильный бычий тренд. Ищите только сигналы на покупку.
- Оценка -2 (Красный): Сильный медвежий тренд. Ищите только сигналы на продажу.
- Оценка 0 (Серый): Нейтральный. Рынок находится в боковом движении или в переходном состоянии. Будьте терпеливы.
- Поддержки/Сопротивления: Показывает, сколько исторических "полов" и "потолков" существует в текущем тренде.
3-этапная стратегия входа
Шаг 1: Определите смещение Ждите, пока цвет свечей и оценка на панели управления достигнут +2 или -2. Это подтверждает, что рынок сломал структуру и начинается тренд.
Шаг 2: Зона ценности Не гонитесь за ценой. Ждите, пока цена откатится (коррекция) к одной из ближайших 3 линий, нарисованных на вашем графике.
- При нисходящем тренде (оценка -2) ждите, когда цена коснется красной линии.
- При восходящем тренде (оценка +2) ждите, когда цена коснется зеленой линии.
Шаг 3: Выполнение Входите в сделку, когда цена коснется линии и покажет отторжение (формирование фитиля).
- Стоп-лосс: Разместите SL сразу за структурной линией.
- Тейк-профит: Цельтесь в следующую структурную линию в направлении тренда.
Профессиональные советы для успеха
- Правило старших таймфреймов: Оценка +2 на графиках H4 или D1 гораздо сильнее, чем на M5. Используйте старший таймфрейм для определения смещения, а младший — для входа.
- Чистые графики: Если экран кажется загроможденным, перейдите в настройки и измените
Max Levels to Showна 2. Это покажет только самые важные "полы" и "потолки". - Зона "Нуля": Когда оценка равна 0, рынок "пересчитывается". Это лучшее время для фиксации прибыли по предыдущим сделкам и ожидания нового прорыва.
Устранение неполадок
- Нет видимых линий? Проверьте, достаточно ли у вас загружено истории на графике. Индикатору нужно минимум 100-200 баров для расчета ATR и уровней Swing.
- Задержка индикатора? Если ваш ПК работает медленно, уменьшите настройку
Max Historical Linesдо 200 для более быстрой очистки памяти.
Часто задаваемые вопросы (FAQ)
В: Перерисовывается ли этот индикатор?
О: Нет. Уровни и оценки рассчитываются на основе подтвержденных закрытий свечей. Как только уровень пробит или оценка изменена на закрытии свечи, это фиксируется в истории.
В: Какой таймфрейм лучше?
О: Логика универсальна. Однако большинство профессиональных трейдеров используют его на графиках H1, H4 или Daily для определения "институциональной структуры". Если вы скальпируете на M1 или M5, ожидайте более частых изменений оценок.
В: Можно ли использовать этот индикатор с другими?
О: Да! Он отлично работает как "направляющий фильтр". Например, принимайте сигналы RSI о перепроданности только если оценка трендового смещения равна +2.
Удачной торговли!
Не является финансовой консультацией. Индикатор Trend Bias Structure — это инструмент технического анализа, предназначенный для помощи трейдерам в определении структуры рынка и трендового смещения.
Сводка
Key features include:
- Smart Structure Mapping: Automatically detects significant support and resistance levels filtered by ATR-based volatility.
- SGE Scoring Engine: Calculates trend strength by counting breached structural levels.
- Anti-Clutter Display: Shows only the three closest relevant levels to maintain chart clarity.
- Momentum Detection: Uses "Big Candle" logic to highlight moves with institutional backing.
- Customizable sensitivity for different assets such as XAUUSD, EURUSD, GBPUSD, and indices.
The indicator works on all timeframes from 1 minute to monthly, with professional traders typically using H1, H4, or daily charts to identify institutional structure. The dashboard provides a clear bias score and structural levels to guide trade entries and exits. Users are advised to trade with the bias, waiting for price pullbacks to the nearest structure lines before executing trades.
This tool is intended as a directional filter and can be combined with other indicators like RSI. It does not repaint, as calculations are based on confirmed candle closes.
Отзывы покупателей
5 | 100 % | |
4 | 0 % | |
3 | 0 % | |
2 | 0 % | |
1 | 0 % |


![Логотип продукта "[Stellar Strategies] Smart ADX"](https://cdn.ctrader.com/image/webp/af13b084-b6f6-41db-b7bc-c7e688b57b05_36929)