
MA Sabres
Indicateur
2 achats
Version 1.0, Aug 2025
Windows, Mac
4.5
Avis : 2
Description
Dominez les marchés avec cet indicateur électrisant qui repère les retournements de tendance grâce à une moyenne mobile dynamique, libérant des formations audacieuses 'Sabre' comme zones de support, résistance ou cassure. Avec des réglages personnalisables et des alertes ultra-précises, c’est votre arme secrète pour des succès en trading !
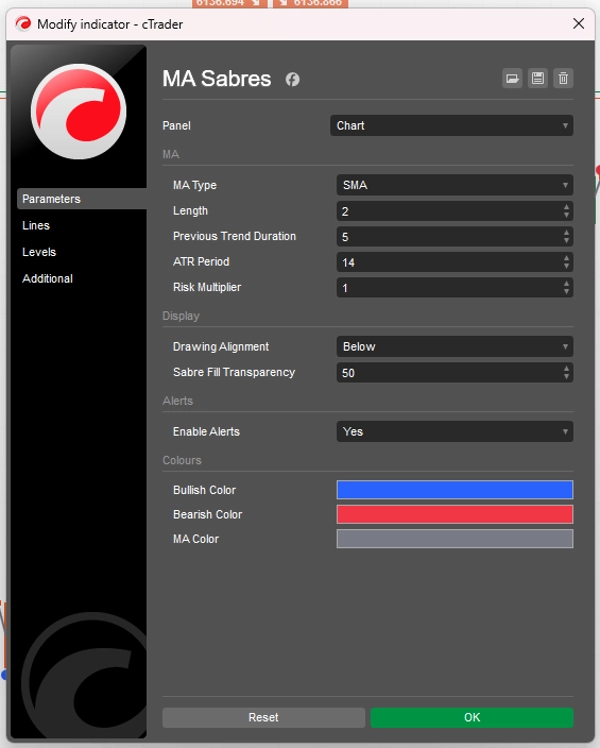
Configuration
- Type de MM : Choisissez votre moyenne mobile dans le menu déroulant (SMA, EMA, SMMA_RMA, HullMA, WMA, VWMA, DEMA, TEMA, NONE pour désactiver). Par défaut, c’est TEMA pour des signaux rapides.
-
- Longueur : Réglez la longueur de la MM et du Sabre (par défaut : 50, min : 1) pour contrôler leur portée.
- Durée de la tendance précédente : Définissez le nombre de barres (par défaut : 20, min : 1) pendant lesquelles la MM doit être en tendance avant qu’un retournement déclenche un Sabre.
- Période ATR : Ajustez la période de l’Average True Range (par défaut : 14, min : 1) pour positionner le Sabre selon la volatilité du marché.
- Multiplicateur de risque : Amplifiez ou réduisez la distance du Sabre par rapport au prix (par défaut : 1.0, plage : 0.1–5.0) pour des signaux plus audacieux ou plus serrés.
- Alignement du dessin : Positionnez les Sabres et cercles au-dessus, en dessous ou centrés (par défaut : centré) pour éviter l’encombrement du graphique.
- Transparence du remplissage du Sabre : Ajustez l’opacité du remplissage (par défaut : 50, plage : 0–100) pour une vue claire.
- Activer les alertes : Activez l’interrupteur (par défaut : faux) pour recevoir des alertes sonores.
Comment utiliser
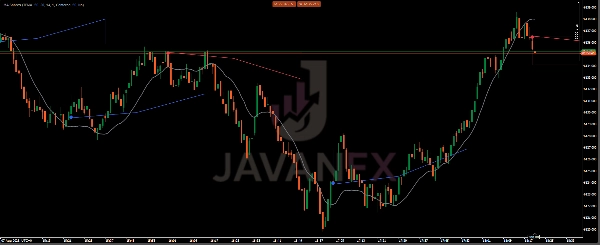
- Repérez les retournements :
-
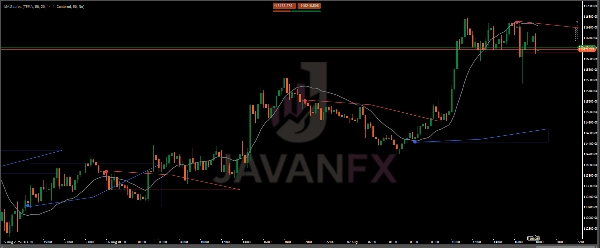
- Cherchez les Sabres (quatre lignes de tendance avec une base remplie) et les cercles (trois icônes superposées) lorsque la MM change après une tendance stable.
- Les Sabres vers le haut avec des cercles bleus signalent une poussée haussière ; les Sabres vers le bas avec des cercles rouges indiquent une chute baissière.
- Ajustez votre configuration :
-
- Réduisez la longueur (ex. : 20) et la durée de la tendance précédente (ex. : 10) pour des mouvements rapides sur des marchés agités.
- Augmentez le multiplicateur de risque (ex. : 2.0) pour des Sabres plus larges en tendance ou baissez-le (ex. : 0.5) pour plus de précision en range.
- Changez l’alignement en Au-dessus ou En-dessous si les chandeliers gênent la visibilité.
- Exploitez les alertes :
-
- Activez EnableAlerts pour des notifications en temps réel sur le graphique.
- Tactiques de trading :
-
- Entrée : Entrez en position longue sur un Sabre/cercle vers le haut ou en position courte sur un vers le bas.
- Sortie : Suivez la ligne de tendance de la MM comme stop ou sortez sur le signal Sabre opposé.
- Validation : Combinez avec des outils comme UT Bot Alert, RSI ou Bandes de Bollinger pour des configurations solides comme le roc.
Résumé
Profil de l'indicateur
Avis clients
4.5
Avis : 2
5 | 50 % | |
4 | 50 % | |
3 | 0 % | |
2 | 0 % | |
1 | 0 % |
Avis clients
October 10, 2025
Smooth and clean ⚡ MA Sabres cuts through noise like blades — great trend clarity, fast updates, and zero lag. Perfect base for MA-based systems!
August 14, 2025
Demo first, then maybe small size if the notes look sane. Account protection still comes first.
Discussion
Questions fréquentes
Les produits disponibles sur cTrader Store, notamment les bots de trading, les indicateurs et les plug-ins, sont fournis par des développeurs tiers et mis à disposition à titre informatif et à des fins d'accès technique uniquement. cTrader Store n'est pas un courtier et ne fournit aucun conseil en investissement, aucune recommandation personnelle ni aucune garantie quant aux performances futures.


Prix
Depuis le 14/07/2025
60
Ventes