
说明
厌倦了滞后的指标和错误信号? 发现枢轴点理论与SuperTrend动量的终极融合,为您提供具有专业准确性的激光般精准的进出点。
🌟 这个指标有什么特别之处?
双重动力技术
- 枢轴点准确性:使用复杂的枢轴点检测识别关键支撑/阻力位
- SuperTrend动量:结合ATR波动率与趋势跟踪的精准性
- 智能信号确认:内置趋势验证,消除错误信号
专业功能
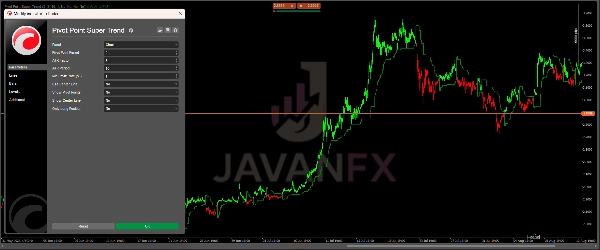
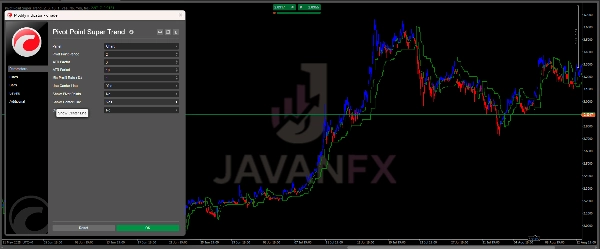
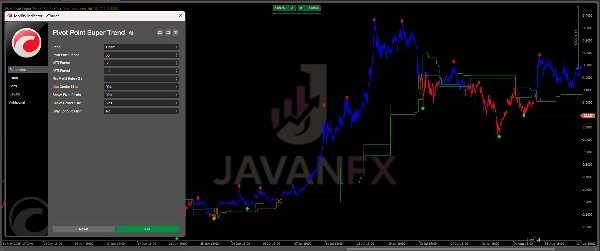
- 🎯 可视化趋势信号:清晰的颜色编码线(绿色=看涨,红色=看跌)
- ⚡ 实时提醒:即时桌面通知入场机会
- 📊 动态枢轴点:自动检测重要市场转折点
- 🎚️ 完全可定制:调整灵敏度以匹配任何交易风格或时间框架
📈 适用于所有市场和时间框架
日内交易者:精准捕捉日内趋势的入场点
波段交易者:自信把握主要趋势
外汇及加密货币交易者:在波动市场表现尤为出色
股票及期货交易者:适用于所有流动性良好的工具
🎯 使用方法(简单且强大)
基本设置:
- 将指标应用 于您的图表(1分钟至周线时间框架)
- 绿色线:价格在上方=买入信号 📈
- 红色线:价格在下方=卖出信号 📉
入场信号:
- 买入 当线变为绿色且价格收盘于其上方
- 卖出 当线变为红色且价格收盘于其下方
- 确认:等待枢轴点对齐以提高准确性
退出策略:
- 止损:位于SuperTrend线的下方/上方
- 获利了结:当趋势线变色或达到关键枢轴水平时
高级功能:
- 中心线:用作动态支撑/阻力以实现部分获利了结
- 枢轴点:主要水平作为进出场确认
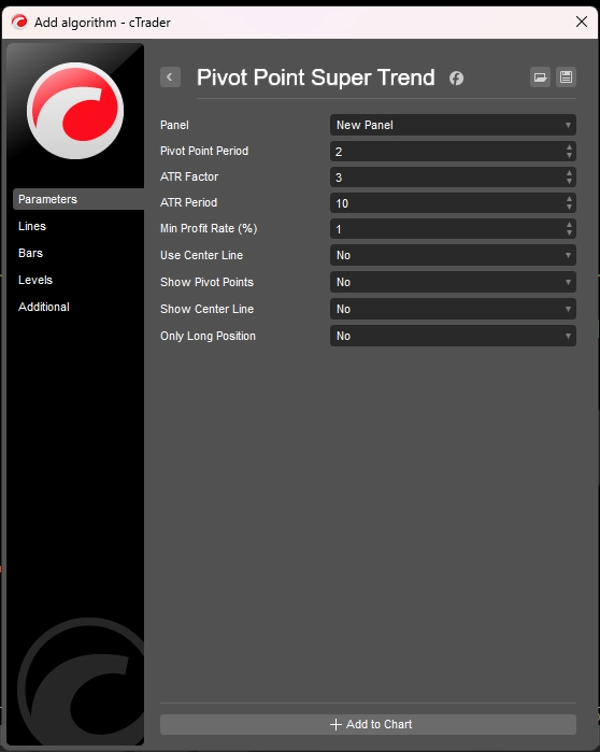
⚙️ 最佳设置
日内交易(1分钟 - 15分钟):
- 枢轴周期:2-3
- ATR因子:2.5-3.5
- ATR周期:10-15
波段交易(1小时 - 日线):
- 枢轴周期:3-5
- ATR因子:3-4
- ATR周期:14-20
波段交易(每周):
- 枢轴周期:5-7
- ATR因子:4-5
- ATR周期:20-25
💡 专业提示
- 结合主要支撑/阻力位 以获得爆炸性效果
- 在多个时间框架上使用 实现共振(例如,1小时趋势+15分钟入场)
- 根据市场波动调整ATR因子
- 对不同设置进行回测 以适应您的特定工具
摘要
AI 摘要
Pivot Point Super Trend is a technical indicator designed to provide precise entry and exit signals by combining pivot point theory with SuperTrend momentum analysis. It identifies key support and resistance levels through advanced pivot point detection and integrates Average True Range (ATR) volatility with trend-following methods to enhance signal accuracy. The indicator features smart signal confirmation to reduce false signals by validating trends before signaling trades.
Key functionalities include color-coded trend lines—green for bullish and red for bearish trends—real-time desktop alerts for trade opportunities, and dynamic pivot points that automatically detect significant market turning points. It is fully customizable, allowing traders to adjust sensitivity settings to suit various trading styles and timeframes.
This indicator supports all markets and timeframes, making it suitable for day traders, swing traders, forex, crypto, stock, and futures traders. Typical usage involves applying the indicator to charts from 1-minute to weekly intervals, interpreting green lines and price above as buy signals, and red lines with price below as sell signals, with pivot point alignment for confirmation. Exit strategies include setting stop losses relative to the SuperTrend line and taking profits at trend changes or pivot levels.
Optimal settings vary by trading style, with specific pivot periods, ATR factors, and ATR periods recommended for day trading, swing trading, and position trading. Additional features include a center line for dynamic support/resistance and partial profit-taking.
指标配置
客户评价
5.0
评价:4
5 | 100 % | |
4 | 0 % | |
3 | 0 % | |
2 | 0 % | |
1 | 0 % |
客户评价
October 10, 2025
Solid fusion ⚡ Pivot + SuperTrend = clean reversals & trend rides. Marks key zones with precision — great edge for intraday and swing trades!
September 4, 2025
the review gets easier when fewer random clicks reach the trade log, and 30 AI calls is a fair first sample.
September 4, 2025
The first test should keep DD under 3 percent, and the idea does not go straight to execution.
August 26, 2025
Not perfect, but the workflow felt cleaner. It works better with a written plan.
讨论
常见问答
cTrader Store 提供的所有产品,包括交易机器人、指标和插件,均由第三方开发者提供,仅供信息参考和技术访问之用。cTrader Store 并非经纪商,不提供投资建议、个人推荐或任何未来业绩保证。


价格
注册日期 14/07/2025
60
销售